


Unsupervised Learning Explained With Real Examples
Imagine that someone gives you a large box filled with mixed objects.
Inside it, you find coins, buttons, keys, toy blocks and paper clips. Nobody tells you what each object is or how you should organise them.
You begin examining them yourself.
You may place all the round objects together. You may create another group for metallic objects and a third group for colourful plastic objects.
Nobody gave you an answer sheet. You discovered the groups by noticing similarities and differences.
That is the basic idea behind unsupervised learning.
A machine receives a collection of data without correct labels. It studies the data and tries to discover useful patterns, natural groups, unusual observations or simpler ways to represent the information.
The machine is not told exactly what answer to produce.
Instead, it asks a broader question:
“What structure can I find inside this data?”
This makes unsupervised learning useful in situations where we have plenty of information but do not already know the correct categories or outcomes.
Google describes clustering as an unsupervised machine learning technique that groups unlabelled examples according to their similarity. Unlike classification, the groups do not arrive with predefined names. People must examine the resulting clusters and decide what they mean.
What Is Unsupervised Learning in Simple Words?
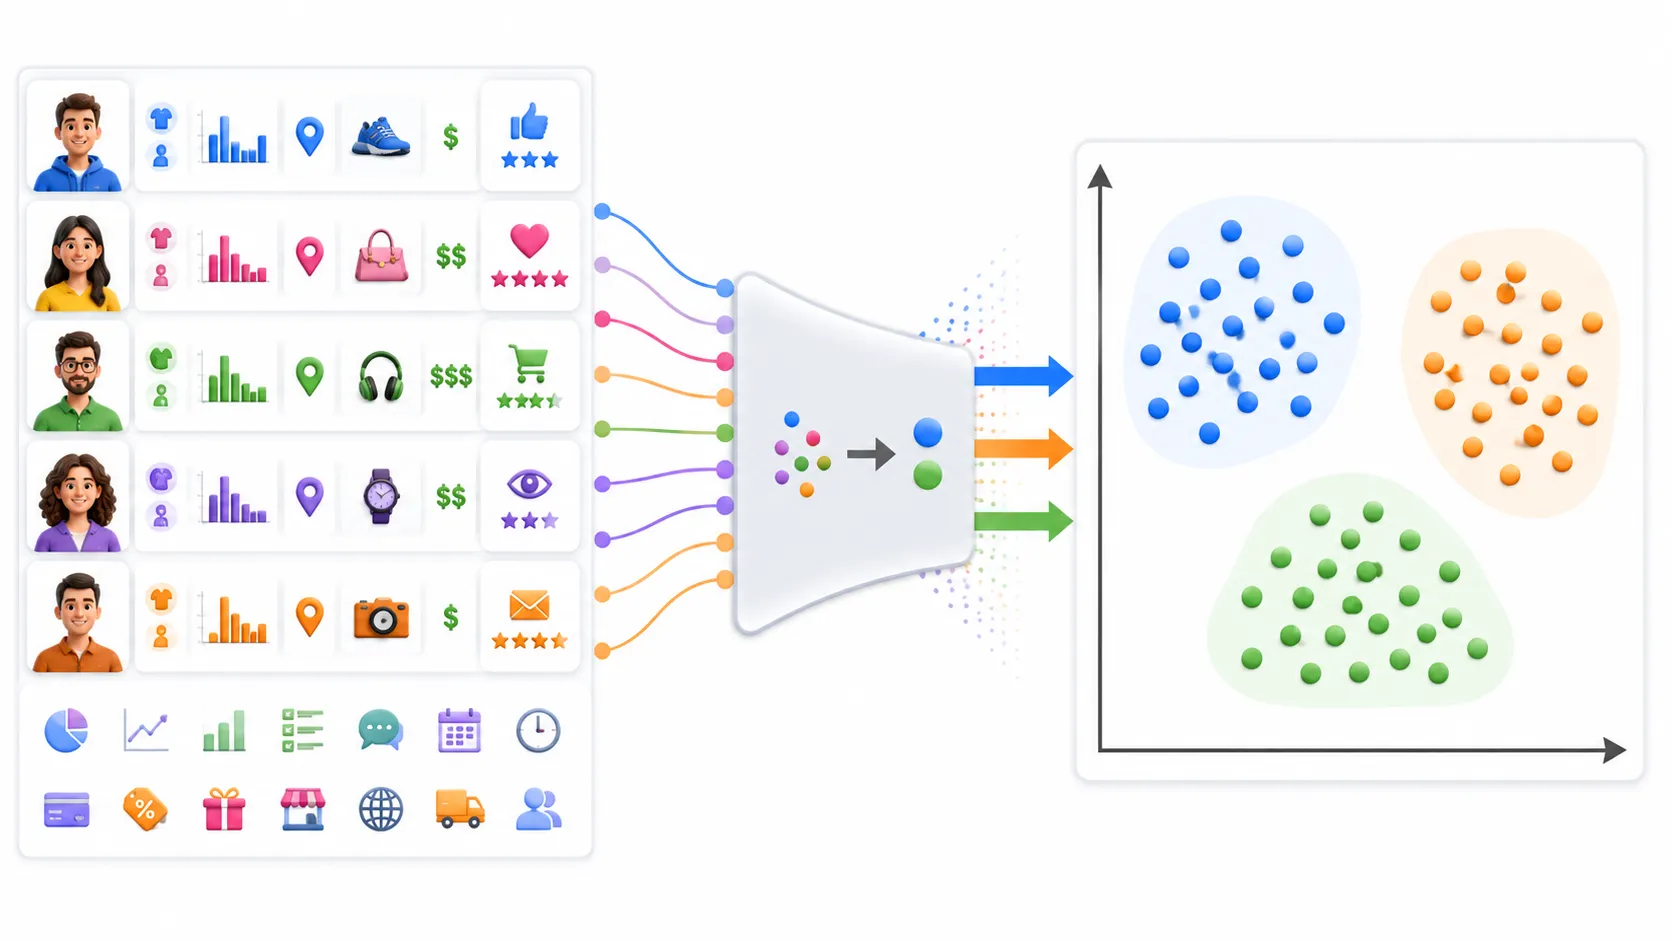
Unsupervised learning is a type of machine learning in which a system analyses unlabelled data and tries to find hidden patterns without being given the correct answers in advance.
Let us understand that through a familiar example.
Suppose you run an online store with 100,000 customers.
You have information such as:
How frequently each customer shops
How much money they usually spend
Which product categories they prefer
Whether they mainly purchase during sales
How long they browse before buying
How often they return products
Whether they use mobile or desktop
However, you have not labelled anyone as a “premium customer,” “discount shopper,” “occasional buyer” or “loyal customer.”
An unsupervised learning algorithm can analyse these behavioural patterns and place similar customers into groups.
It may discover one group that buys frequently but spends small amounts. Another group may purchase rarely but place expensive orders. A third group may shop only when discounts are available.
The algorithm discovers the groups, but it does not automatically understand their business meaning.
A marketing team must study each group and decide how to describe it.
This distinction is important.
The machine may identify Cluster A, Cluster B and Cluster C. A human analyst may later interpret them as loyal customers, seasonal buyers and price-sensitive shoppers.
Simple takeaway: Unsupervised learning finds patterns. Humans still need to understand what those patterns mean.
Why Do We Need Unsupervised Learning?
You may be wondering why we cannot simply label all the data first.
Sometimes we can. In many real situations, however, manual labelling is too expensive, slow or difficult.
Imagine an e-commerce company with millions of customer activity records.
A human team could manually place customers into categories, but those categories would be based on assumptions made before analysing the complete data.
The team may decide that only three customer types exist. The actual behaviour may contain seven meaningful groups that nobody expected.
Unsupervised learning allows the data to reveal structures that were not defined in advance.
It is particularly useful when:
We do not know what groups exist.
The dataset is too large to inspect manually.
Labels are unavailable or expensive to create.
We want to explore data before building another model.
We need to identify rare or unusual behaviour.
We want to reduce a complex dataset into a simpler form.
This does not mean that the machine magically understands the data.
It means the algorithm uses mathematical measures of similarity, distance, density or variation to organise it.
Labelled Data vs Unlabelled Data
The difference between labelled and unlabelled data becomes easy to understand through photographs.
Suppose you have 10,000 animal images.
A labelled dataset may contain:
Image 1 — Dog
Image 2 — Cat
Image 3 — Horse
Image 4 — Dog
Each image already has a correct category.
A supervised learning model can use these examples to learn how to classify a new image.
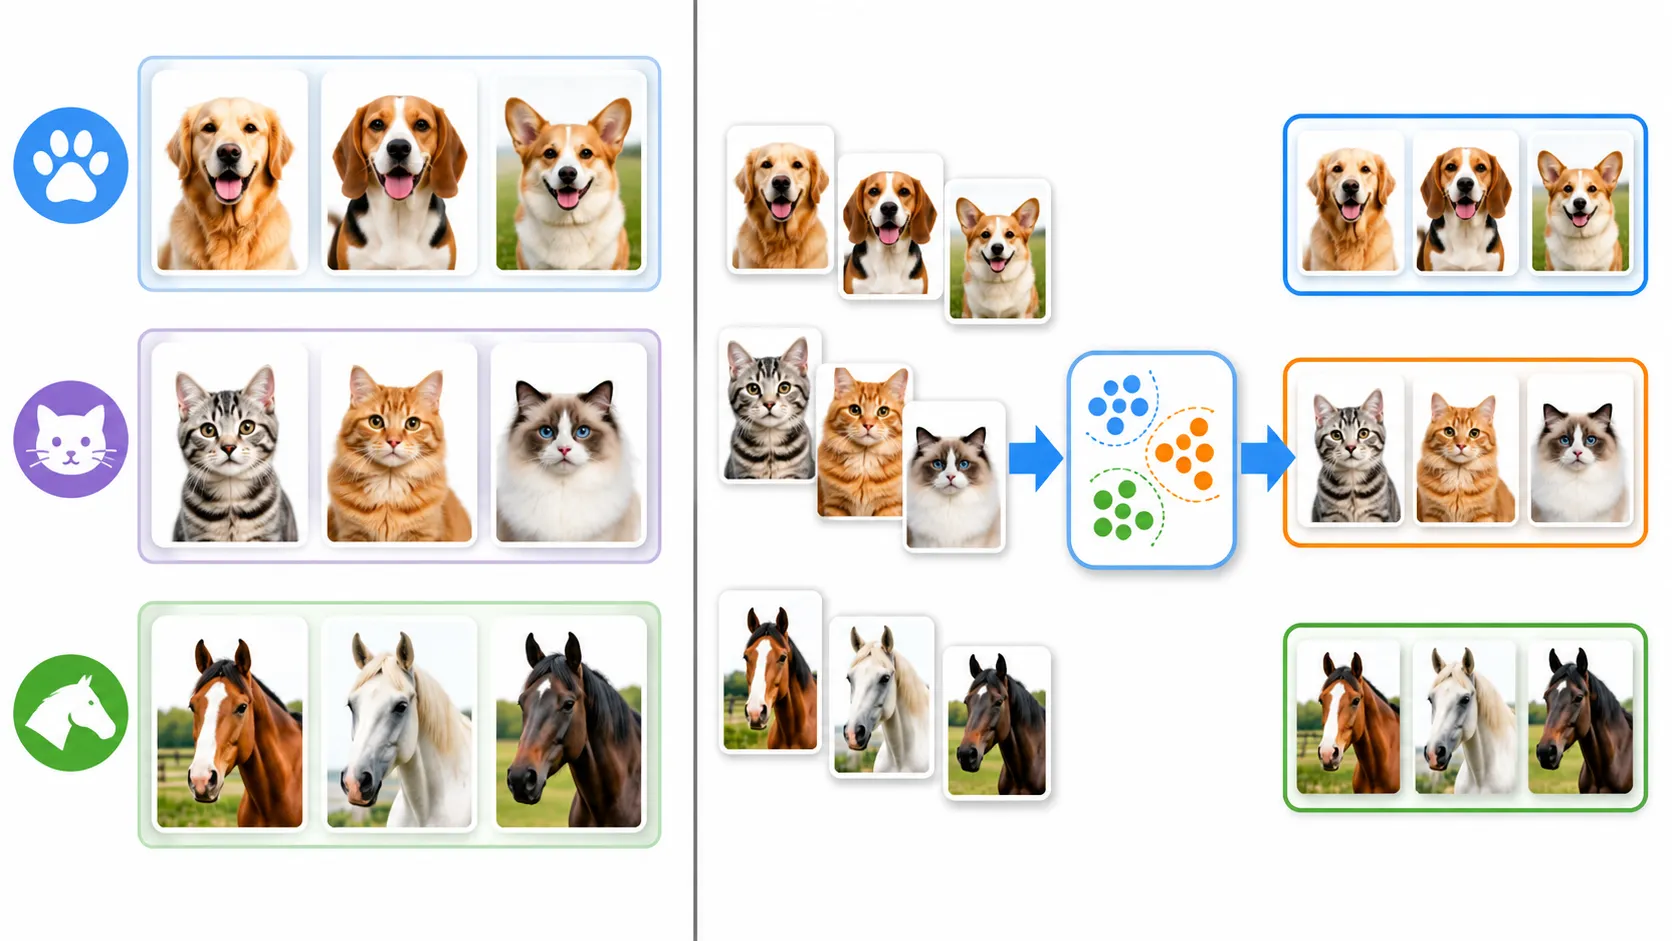
Now imagine that the same photographs arrive without names.
The system does not know which image contains a dog or a cat.
It can still compare visual characteristics such as shapes, colours, textures and patterns. It may place similar-looking animals together.
However, the resulting groups may simply be called:
Cluster 1
Cluster 2
Cluster 3
A person must inspect those groups and determine that Cluster 1 mostly contains dogs, Cluster 2 contains cats and Cluster 3 contains horses.
Why Is It Called “Unsupervised” Learning?
The word unsupervised means the model does not receive a traditional answer sheet during training.
In supervised learning, every example contains a known target.
A spam-filter dataset may clearly identify each email as:
Spam
Not spam
The model can compare its prediction with the correct label and calculate whether it made a mistake.
In unsupervised learning, those answers are missing.
The system receives the emails but is not told which ones are spam. It may group emails according to sender behaviour, repeated phrases, number of links or writing patterns.
One group may contain suspicious promotional messages, but the algorithm does not begin with the instruction, “Find spam.”
It only searches for structure.
Here is a simple classroom analogy.
A supervised learning student receives a worksheet with questions and correct answers.
An unsupervised learning student receives a pile of books and is asked:
“Can you organise these in a useful way?”
The student may group them by subject, author, language, size or reading difficulty.
There may not be one universally correct arrangement. The usefulness of the groups depends on the purpose.
How Does Unsupervised Learning Work?
At a high level, the process begins with a dataset containing features but no predefined target labels.
Suppose an online store wants to understand customer behaviour.
Each customer may be represented using features such as:
Average order value
Number of purchases
Days since the last order
Preferred product category
Discount usage
Return frequency
The algorithm compares customers according to these features.
Customers with similar behaviour are placed closer together mathematically. Customers with very different behaviour are placed farther apart.
The system may then form groups in which:
Members of the same group are relatively similar.
Members of different groups are relatively different.
This process is known as clustering, one of the most widely used unsupervised learning techniques. Official scikit-learn documentation describes clustering as the automatic grouping of similar objects, with applications including customer segmentation and grouping experimental results.
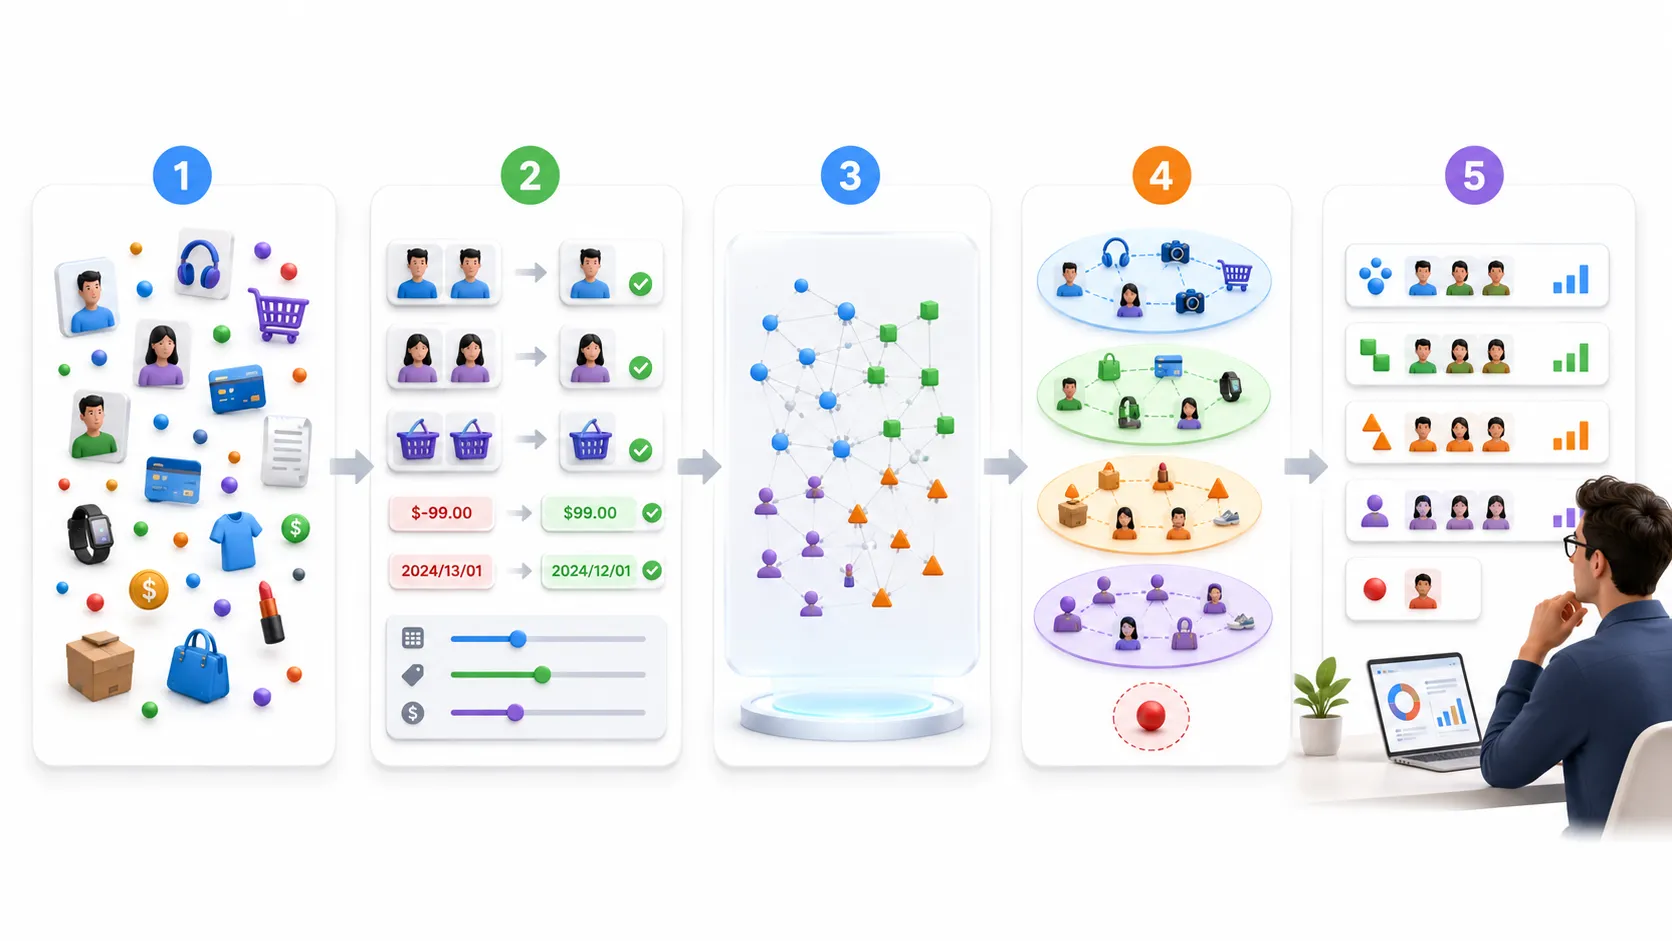
A simplified process looks like this:
Collect unlabelled data.
Select useful features.
Clean and standardise the information.
Measure similarity between data points.
Apply an unsupervised learning algorithm.
Examine the groups or patterns it discovers.
Interpret whether those results are useful.
Unsupervised Learning Does Not Always Find the “Correct” Answer
This is one of the most important ideas to understand.
In supervised learning, we can compare predictions with known labels.
In unsupervised learning, there may be no ground truth showing the perfect grouping.
The same customers may be organised differently depending on:
Which features are selected
How the features are scaled
Which similarity measurement is used
Which algorithm is selected
How many clusters are requested
What business question is being answered
Google’s clustering guidance notes that evaluating clusters is difficult because unsupervised datasets usually do not provide correct labels against which the result can be checked. Real datasets also rarely contain perfectly separated groups.
For example, customers could be grouped by spending behaviour for a marketing campaign.
The same customers could be grouped differently according to return behaviour for a fraud investigation.
Neither result is automatically wrong. They answer different questions.
That is why unsupervised learning requires both technical analysis and human judgement.
The algorithm can reveal structure, but someone must decide whether that structure is meaningful, stable and useful.
The Main Jobs of Unsupervised Learning
Unsupervised learning is not limited to creating customer groups.
Its main uses include:
Clustering: Grouping similar records
Anomaly detection: Finding unusual or suspicious observations
Dimensionality reduction: Simplifying datasets with many features
Association discovery: Finding items or behaviours that frequently occur together
Data exploration: Revealing patterns before a prediction problem is fully defined
Two of the most practical applications are customer segmentation for e-commerce and anomaly detection.
Customer segmentation helps businesses understand different types of shoppers without manually defining every category in advance.
Anomaly detection searches for behaviour that does not fit the normal pattern, such as an unusual transaction, faulty sensor reading or unexpected account activity.
To understand these applications properly, we first need to study the major types of unsupervised learning and the algorithms that create these hidden groups.
That is where the next part begins.
Main Types of Unsupervised Learning
Unsupervised learning is not only about dividing data into groups.
It can also help us find unusual behaviour, reduce complex data and discover patterns that may not be easy to see manually.
The main uses of unsupervised learning are:
Clustering
Anomaly detection
Dimensionality reduction
Association rule learning
We will start with clustering because it is one of the easiest and most useful parts of unsupervised learning.
What Is Clustering in Machine Learning?
Clustering means placing similar data points into the same group.
Each group is called a cluster.
A good clustering result usually has two qualities:
Data points inside one cluster are similar.
Data points in different clusters are less similar.
Let us understand this with an online shopping example.
Imagine an e-commerce website with thousands of customers.
Some customers buy something every month. Some customers only shop during sales. Some customers place very few orders, but they buy expensive products.
The business may not have already named these customer types.
A clustering algorithm can study their behaviour and separate them into different groups.
For example, it may create:
Cluster 1
Cluster 2
Cluster 3
The algorithm does not automatically know that Cluster 1 contains loyal customers or that Cluster 2 contains discount shoppers.
A human team studies each cluster and gives it a useful name.
Simple idea: The algorithm creates the groups. People decide what those groups mean.
How Does a Machine Decide Which Customers Are Similar?
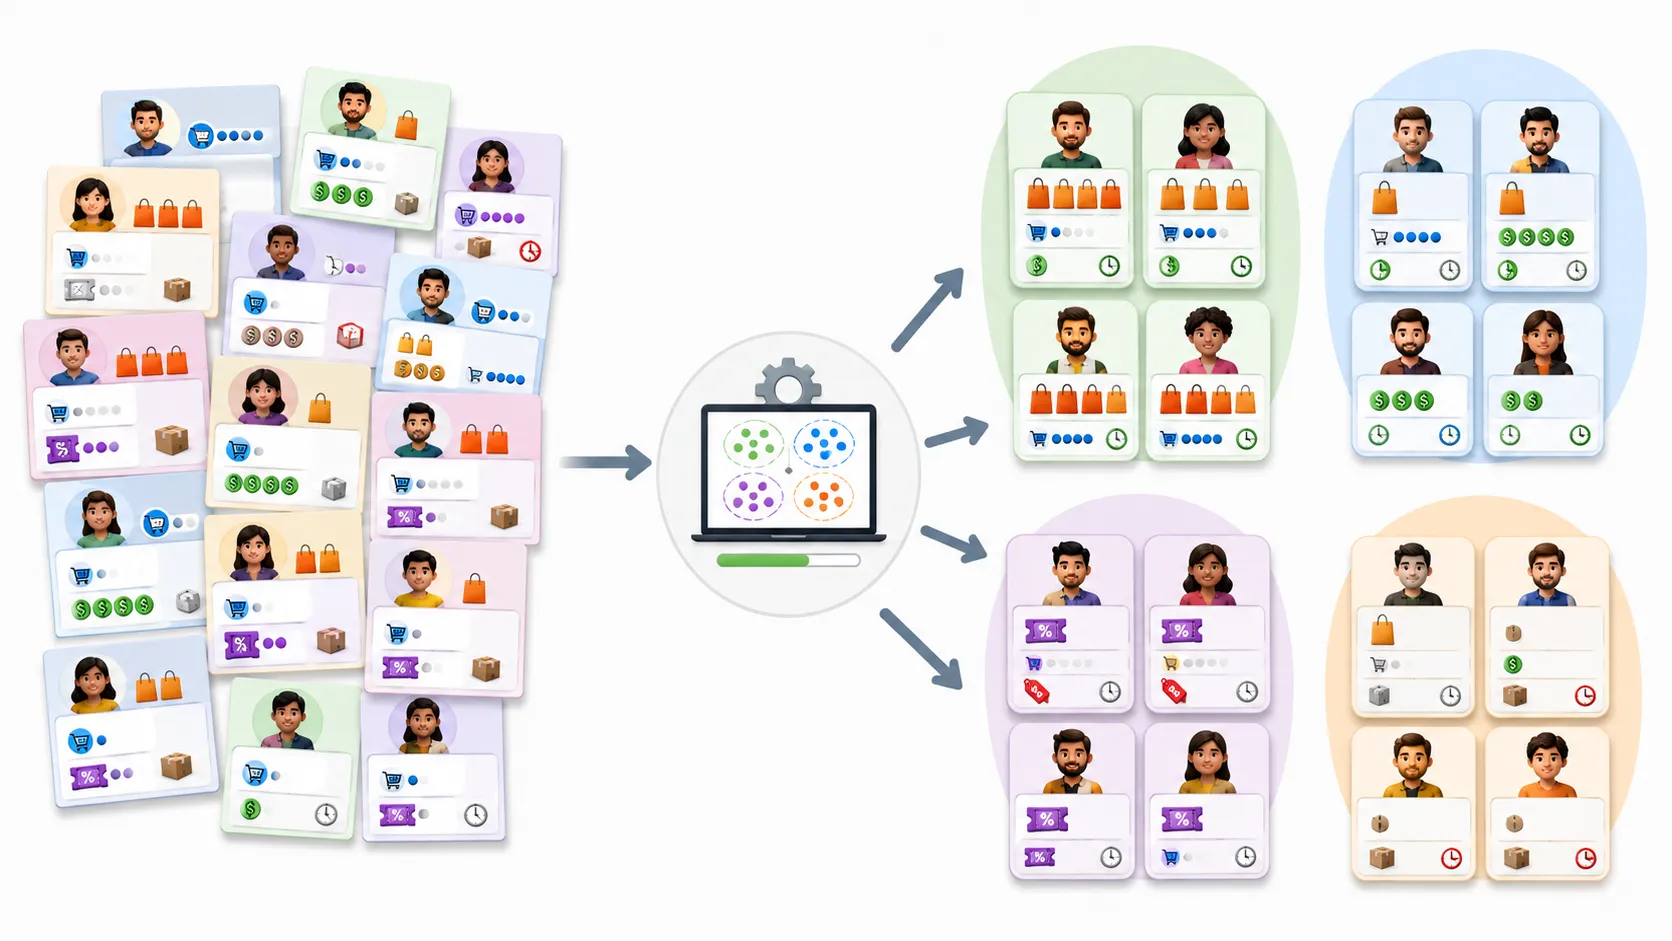
A computer does not understand customers in the same way a shopkeeper does.
It compares numbers and patterns.
For example, each customer may have features such as:
Total number of orders
Average order value
Days since the last purchase
Percentage of orders placed during sales
Number of returned products
Time spent on the website
Most purchased product category
Now imagine two customers.
Customer A:
Places one order every month
Spends around £45 per order
Rarely returns products
Does not wait for discounts
Customer B:
Also shops every month
Spends around £50 per order
Has a low return rate
Usually buys without a coupon
Their behaviour is quite similar.
The algorithm may place them in the same cluster.
Now imagine Customer C.
This customer shops only twice a year and only during a major sale.
Customer C behaves differently, so the algorithm may place them in another cluster.
The machine finds these similarities by measuring the distance between data points.
Customers with similar behaviour are treated as close to each other. Customers with very different behaviour are treated as far apart.
Why Feature Scaling Matters
Before clustering, the data often needs to be scaled.
Let us say we use two features:
Number of yearly orders: between 1 and 20
Yearly spending: between £100 and £20,000
The spending numbers are much larger than the order numbers.
If we use the data without scaling, the algorithm may give too much importance to spending and almost ignore order frequency.
Feature scaling brings different values into a similar range.
Here is a simple example.
Imagine comparing the height of one person in centimetres and another person in metres.
The values will look very different even if both people have almost the same height.
We need to use the same measurement system before comparing them.
The same idea applies to machine learning data.
Good data cleaning and scaling can change the quality of the final clusters.
K-Means Clustering Explained Simply
K-means clustering is one of the most popular clustering algorithms.
It divides data into a fixed number of groups.
The letter K means the number of clusters we want.
If K equals 3, the algorithm will try to create three clusters.
If K equals 5, it will try to create five clusters.
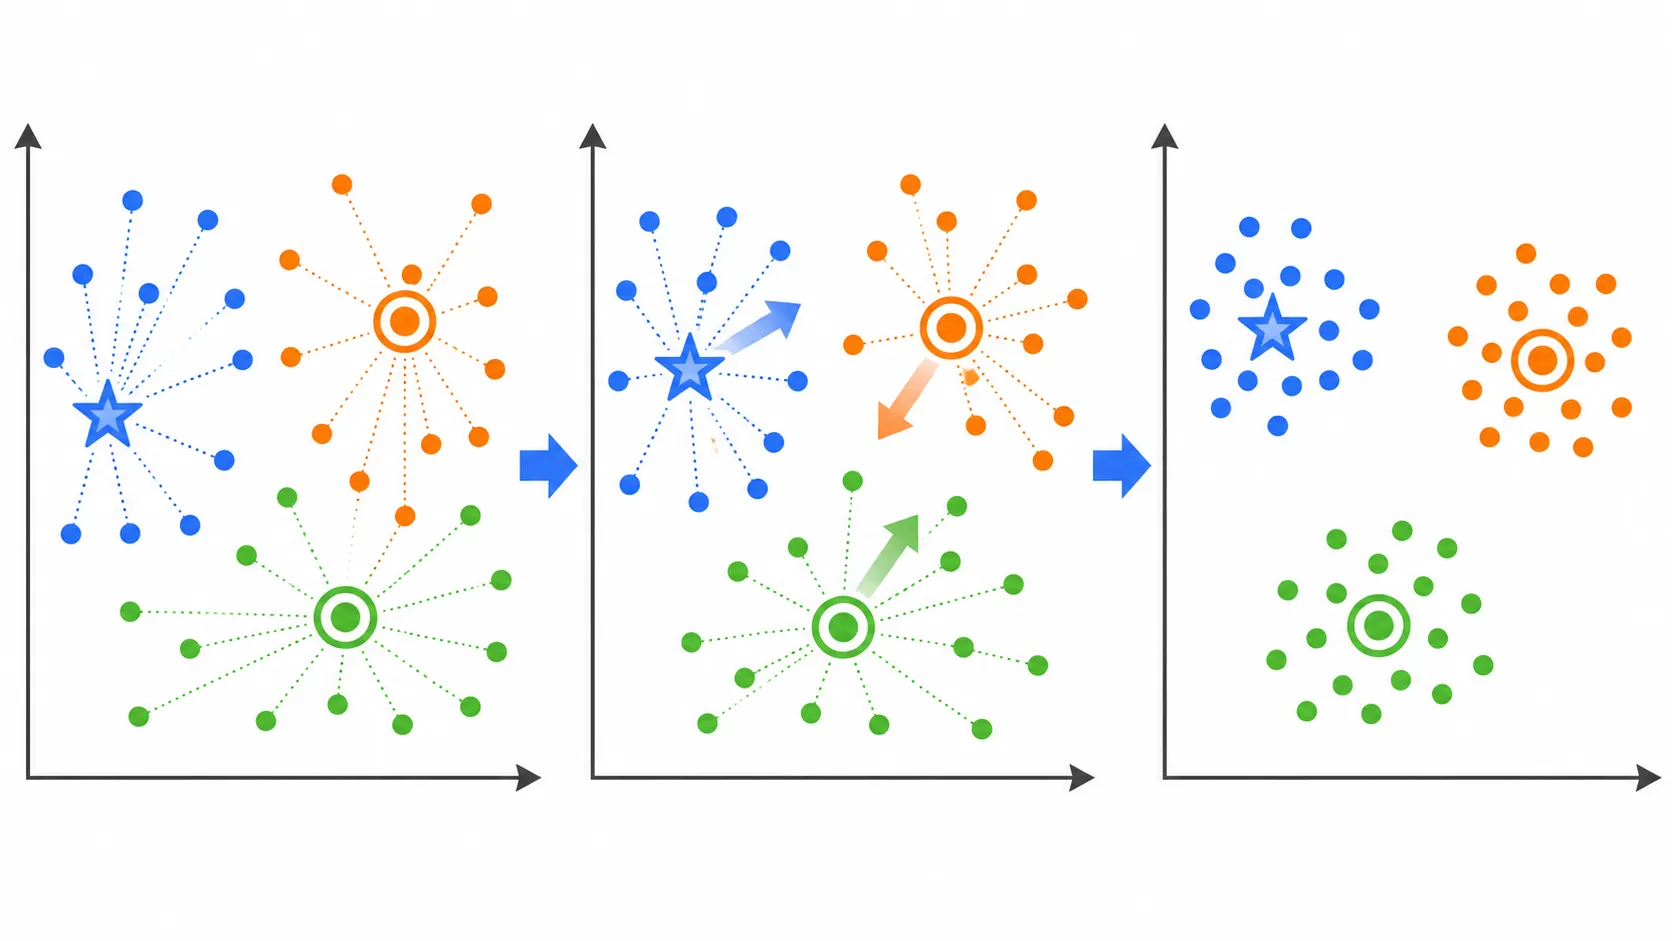
How Does K-Means Work?
Suppose we choose K = 3.
The algorithm usually follows these steps:
It selects three starting centre points.
It places every customer near the closest centre.
It calculates the average centre of each group.
It moves the centre to that new position.
It checks the customers again.
It repeats the process until the groups stop changing much.
The centre of a cluster is called a centroid.
Let us use a playground example.
Imagine many children standing in a playground.
Three teachers stand at different places.
Each child walks towards the nearest teacher.
After the groups are formed, every teacher moves to the middle of their group.
Now some children may find that another teacher is closer, so they change groups.
The teachers again move to the centre.
This continues until the groups become stable.
That is close to how K-means works.
How Do We Choose the Right Value of K?
One of the biggest questions in K-means is:
How many clusters should we create?
If we choose too few clusters, very different customers may be placed in the same group.
If we choose too many clusters, the groups may become too small and difficult to use.
There is no perfect value of K for every dataset.
Teams may use methods such as the elbow method to compare different cluster counts.
They also need to check whether the final groups make business sense.
For example, a graph may suggest six clusters, but a marketing team may only be able to create useful campaigns for four clear customer groups.
The technical result and the business need should work together.
Limits of K-Means
K-means is simple and useful, but it is not perfect.
It works best when clusters are roughly round and similar in size.
It may struggle when:
Clusters have unusual shapes
Some groups are very small
Data contains many outliers
The correct number of clusters is unknown
Features have not been scaled properly
K-means is also sensitive to its starting centre points.
Different starting points can sometimes produce different groups.
This is why the algorithm may be run several times before choosing the best result.
Hierarchical Clustering Explained
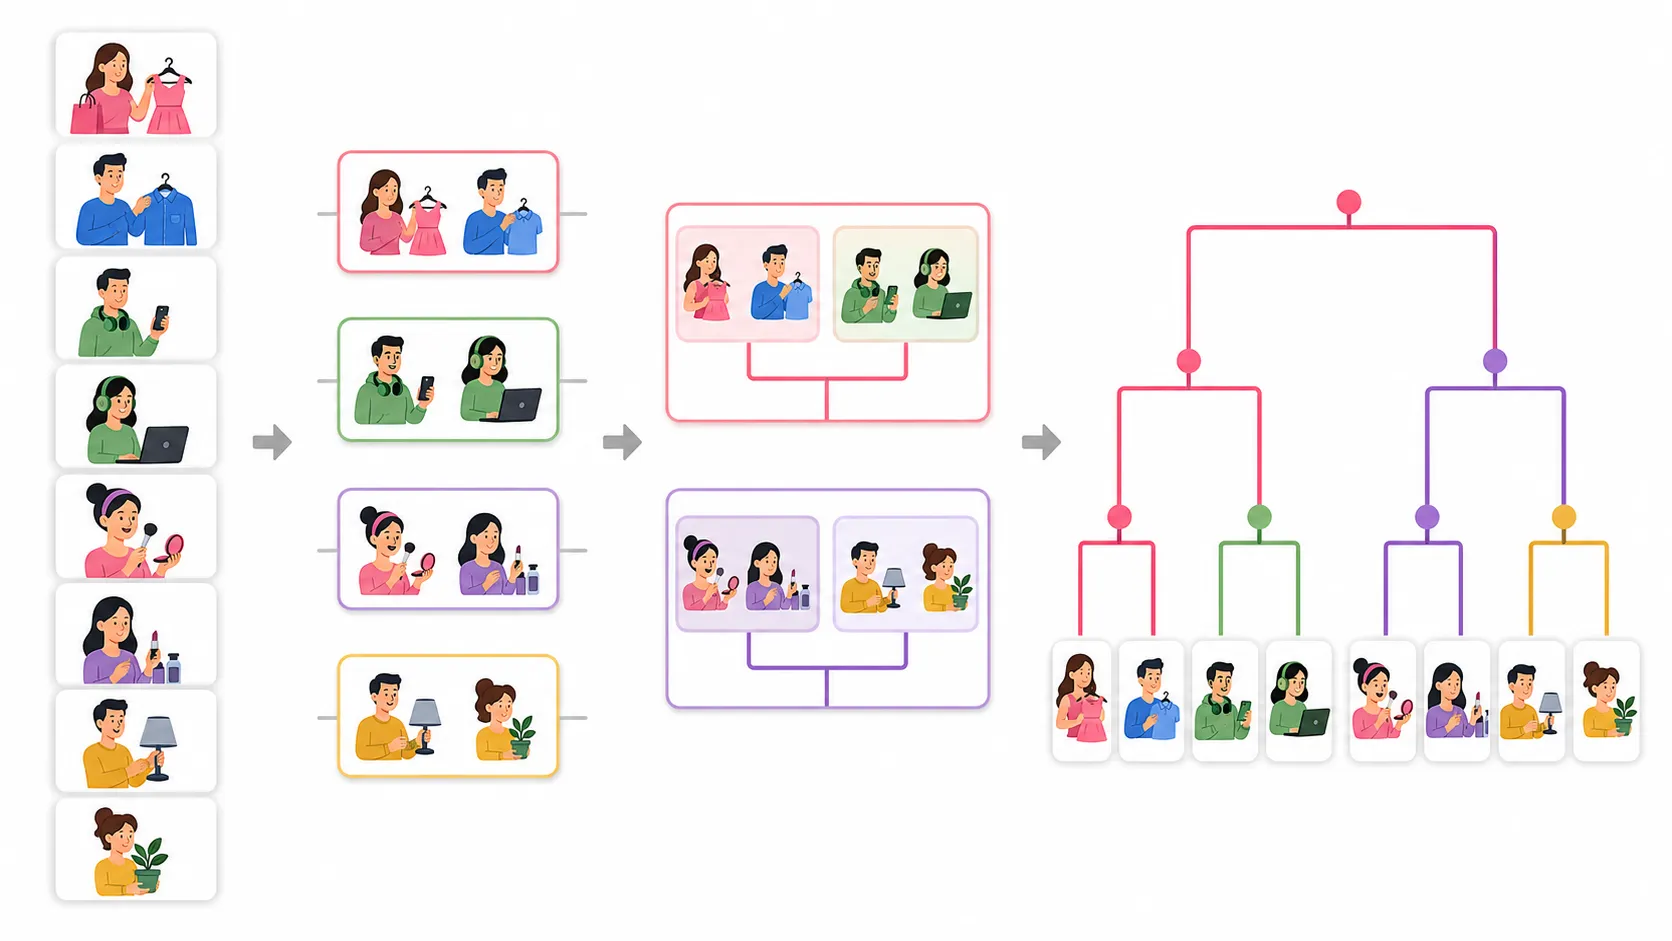
Hierarchical clustering builds a tree of groups.
Instead of only giving us one final set of clusters, it shows how smaller groups connect to larger groups.
Imagine organising a family tree.
At the lowest level, each person is separate.
Then close family members are joined.
Those small family groups are then connected to larger branches.
Hierarchical clustering works in a similar way.
It can start with every data point as its own cluster.
Then it joins the most similar points or groups step by step.
This process creates a tree-like chart called a dendrogram.
A dendrogram helps us see:
Which customers are very similar
Which groups join together
Where larger customer groups are formed
How many clusters may be useful
When Is Hierarchical Clustering Useful?
Hierarchical clustering is useful when we want to understand the relationship between groups.
For example, an online store may discover:
Premium customers
Regular customers
Discount-focused customers
Occasional customers
Inside premium customers, there may be smaller groups such as:
Premium fashion buyers
Premium electronics buyers
Premium beauty buyers
Hierarchical clustering can show both the large group and the smaller groups inside it.
Its main drawback is speed.
It can become slow when the dataset contains a very large number of records.
For millions of customers, other algorithms may be more practical.
DBSCAN Explained Simply
DBSCAN is another clustering algorithm.
Its full name is Density-Based Spatial Clustering of Applications with Noise, but you do not need to memorise that name.
The main idea is simple.
DBSCAN looks for areas where many data points are packed closely together.
These dense areas become clusters.
Points that are far away from every dense group may be marked as noise or outliers.
Imagine people standing in a large park.
In some areas, many people are standing close together. These areas form groups.
A few people are standing alone, far from everyone else.
DBSCAN can recognise the crowded groups and mark the isolated people as unusual points.
Why Is DBSCAN Useful?
DBSCAN can find clusters with unusual shapes.
It also does not require us to choose the number of clusters in advance.
This makes it useful for data where K-means may not work well.
For example, DBSCAN can help detect:
Unusual customer activity
Strange location patterns
Suspicious account behaviour
Groups with irregular shapes
Isolated data points
However, DBSCAN can struggle when different parts of the data have very different levels of density.
Its results also depend on the settings chosen by the analyst.
Customer Segmentation for E-Commerce
Now let us connect these ideas with a complete business example.
Suppose an e-commerce company wants to understand its customers better.
The company has data such as:
Total spending
Number of purchases
Average order value
Days since the last purchase
Product categories
Return frequency
Coupon usage
Device type
The company does not already know the best customer groups.
This makes unsupervised learning a useful option.
First, the team cleans the data.
It removes duplicates, fixes missing values and scales numerical features.
Then it applies a clustering algorithm.
The result may reveal groups such as:
Loyal Regular Customers
These customers shop often, spend a steady amount and rarely return products.
The business may offer them early access to products or loyalty rewards.
High-Value Occasional Buyers
These customers do not shop often, but their orders are expensive.
The company may send them premium product recommendations instead of frequent discount messages.
Discount-Focused Shoppers
These customers mostly buy during sales and use coupons.
The business may target them with time-limited offers.
At-Risk Customers
These customers used to shop frequently but have not placed an order recently.
The company may send a reminder, collect feedback or offer relevant help.
High-Return Customers
These customers purchase often but return many products.
The business may study whether product descriptions, sizing information or delivery quality are causing the problem.
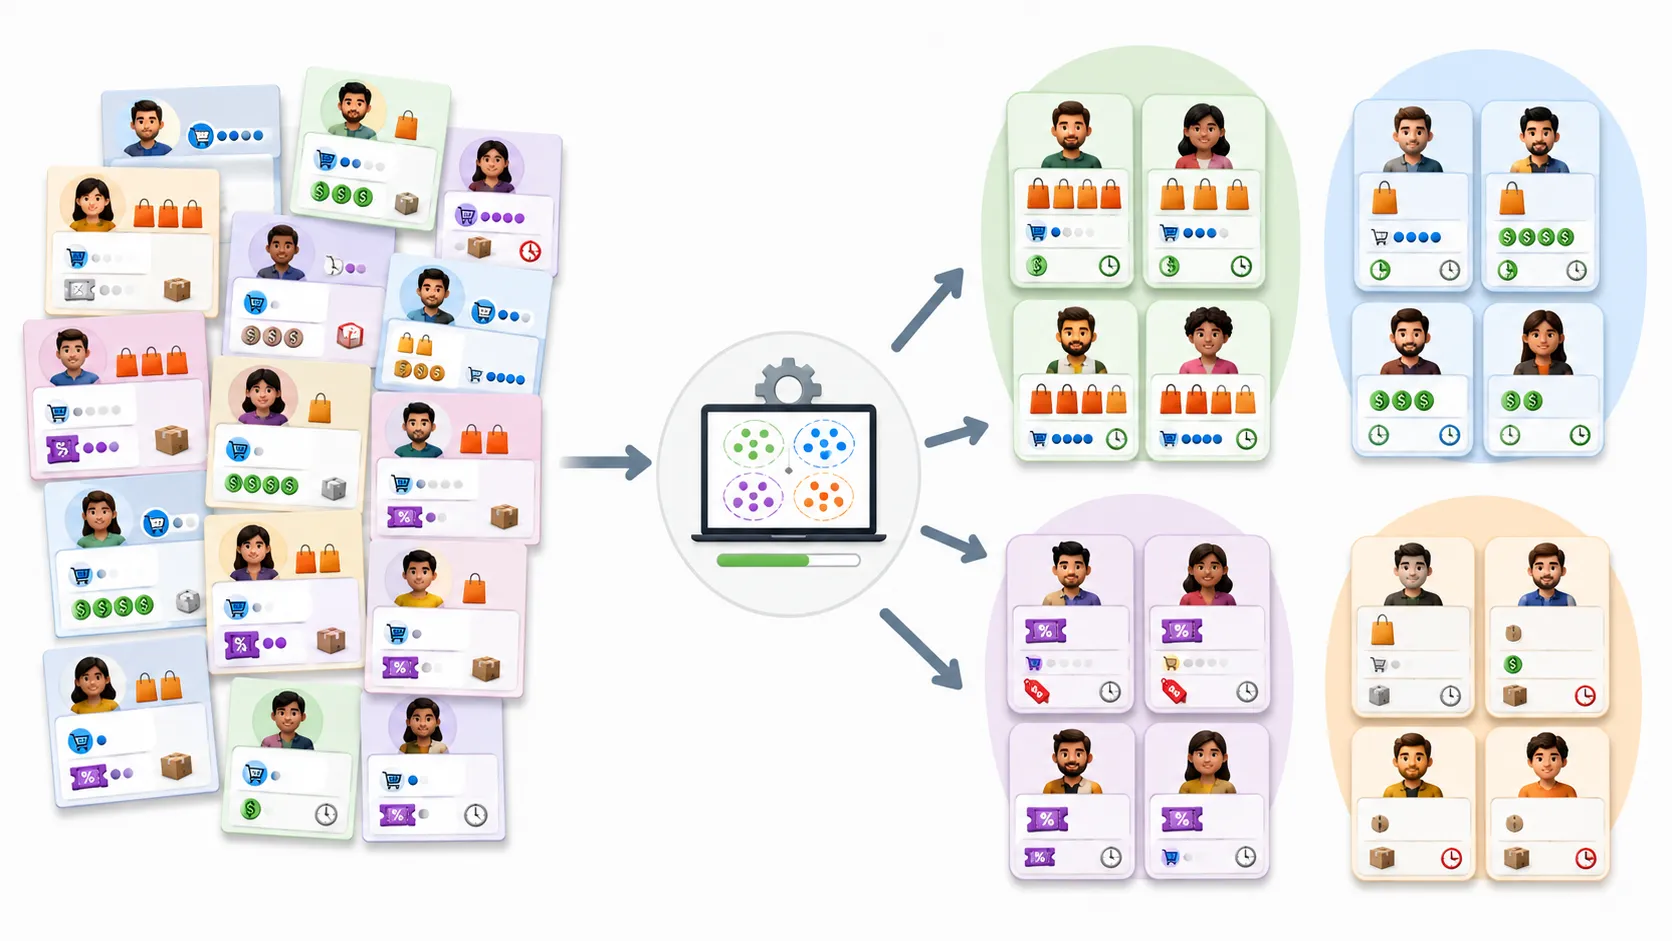
The important point is that these groups were not manually created before the analysis.
The algorithm found behaviour patterns in the data.
The business team then checked whether those patterns were useful.
Customer segmentation can improve:
Email campaigns
Product recommendations
Loyalty programmes
Customer retention
Discount planning
Inventory decisions
Customer support
But clustering should not be treated as unquestionable truth.
Customer behaviour changes.
A person may move from one cluster to another over time.
The company must regularly review whether the groups are still useful and fair.
Clustering helps us understand common behaviour.
The next challenge is very different.
Instead of looking for large groups, we may want to find the few data points that do not fit anywhere.
That process is called anomaly detection,
What Is Anomaly Detection?
Clustering helps us find common groups.
Anomaly detection does the opposite.
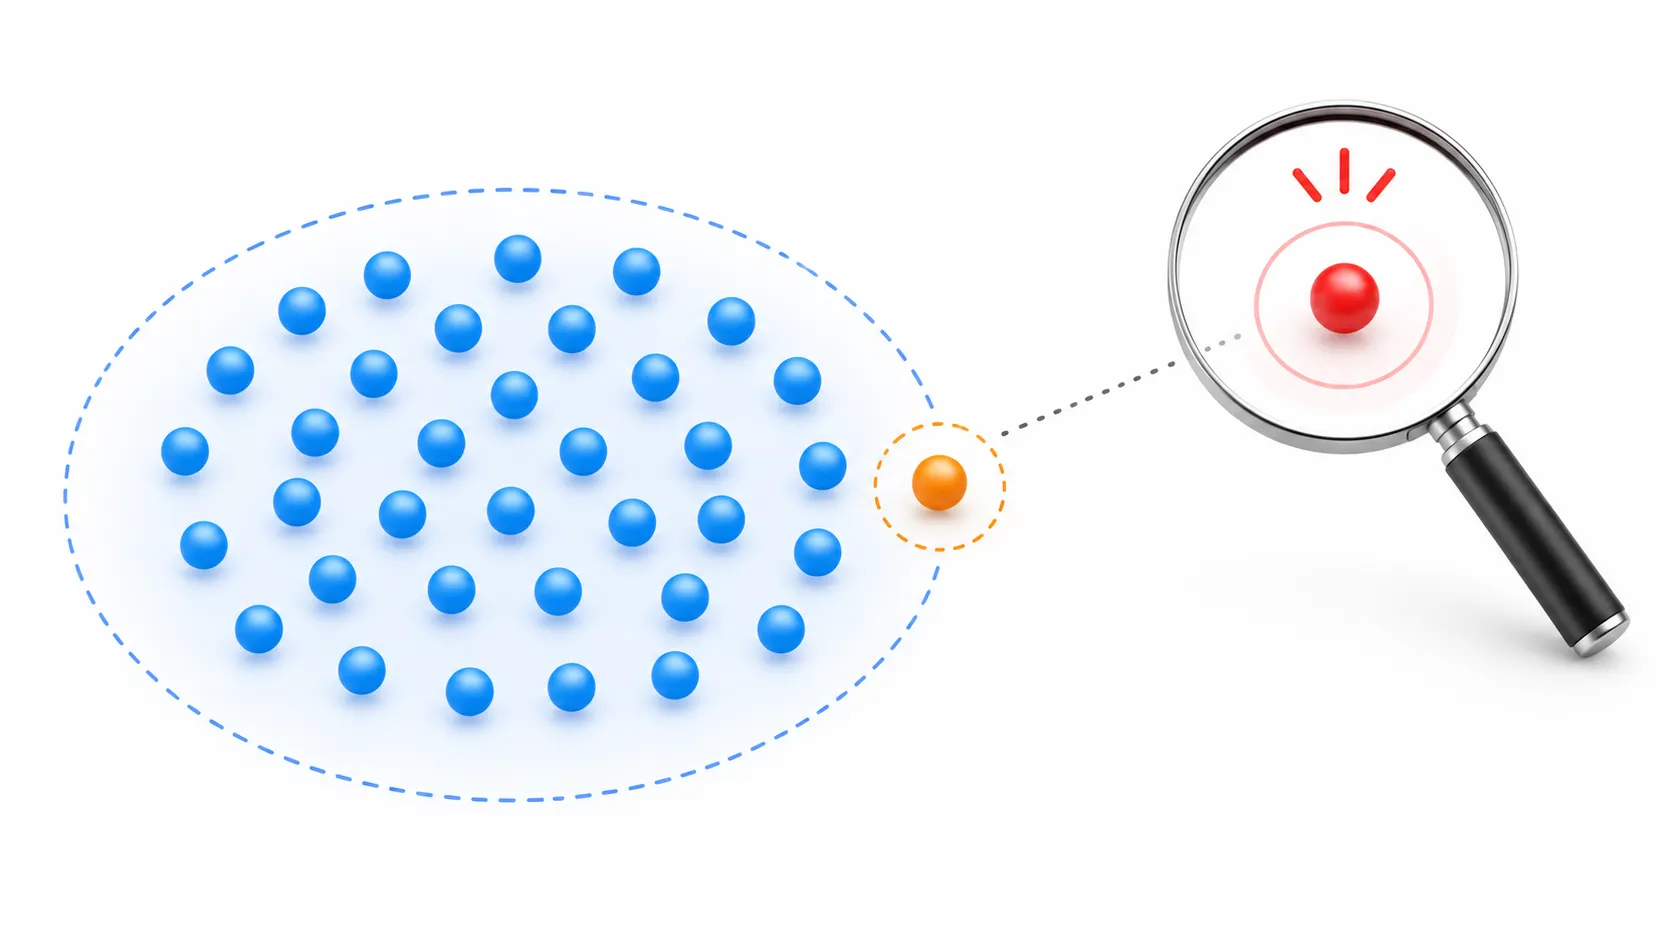
It looks for data points that are very different from normal behaviour.
An anomaly may be:
An unusual bank transaction
A sudden rise in website traffic
A machine producing an unexpected temperature
A customer placing an order from a new country
A login attempt from an unknown device
A product return pattern that looks different from normal activity
Anomalies are also called outliers.
Let us understand this with a simple classroom example.
Imagine that almost every student in a class scores between 60 and 85 marks.
One student scores 5 marks, while another student scores 100.
Both results are far from the normal pattern.
This does not automatically mean that something is wrong.
The student with 5 marks may have been ill. The student with 100 marks may have prepared very well.
Anomaly detection only tells us that something is unusual. A human or another system must check the reason.
Simple idea: An anomaly is not always a problem. It is a signal that deserves attention.
How Does Anomaly Detection Work?
An anomaly detection system first tries to understand what normal behaviour looks like.
Suppose an online store studies customer orders.
A normal customer may:
Place one or two orders a month
Use the same delivery address
Pay with a known card
Buy products from familiar categories
Log in from the same country
Now imagine that the same account suddenly:
Places ten expensive orders
Uses a new payment method
Logs in from another country
Changes the delivery address
Buys products never purchased before
Each action alone may be normal.
But when many unusual changes happen together, the system may mark the activity as suspicious.
The result could be:
Anomaly score: High
Action: Send for review
The system should not immediately assume fraud.
A genuine customer may be travelling, buying gifts or using a new card.
This is why anomaly detection often works best as an alert system rather than a final decision-maker.
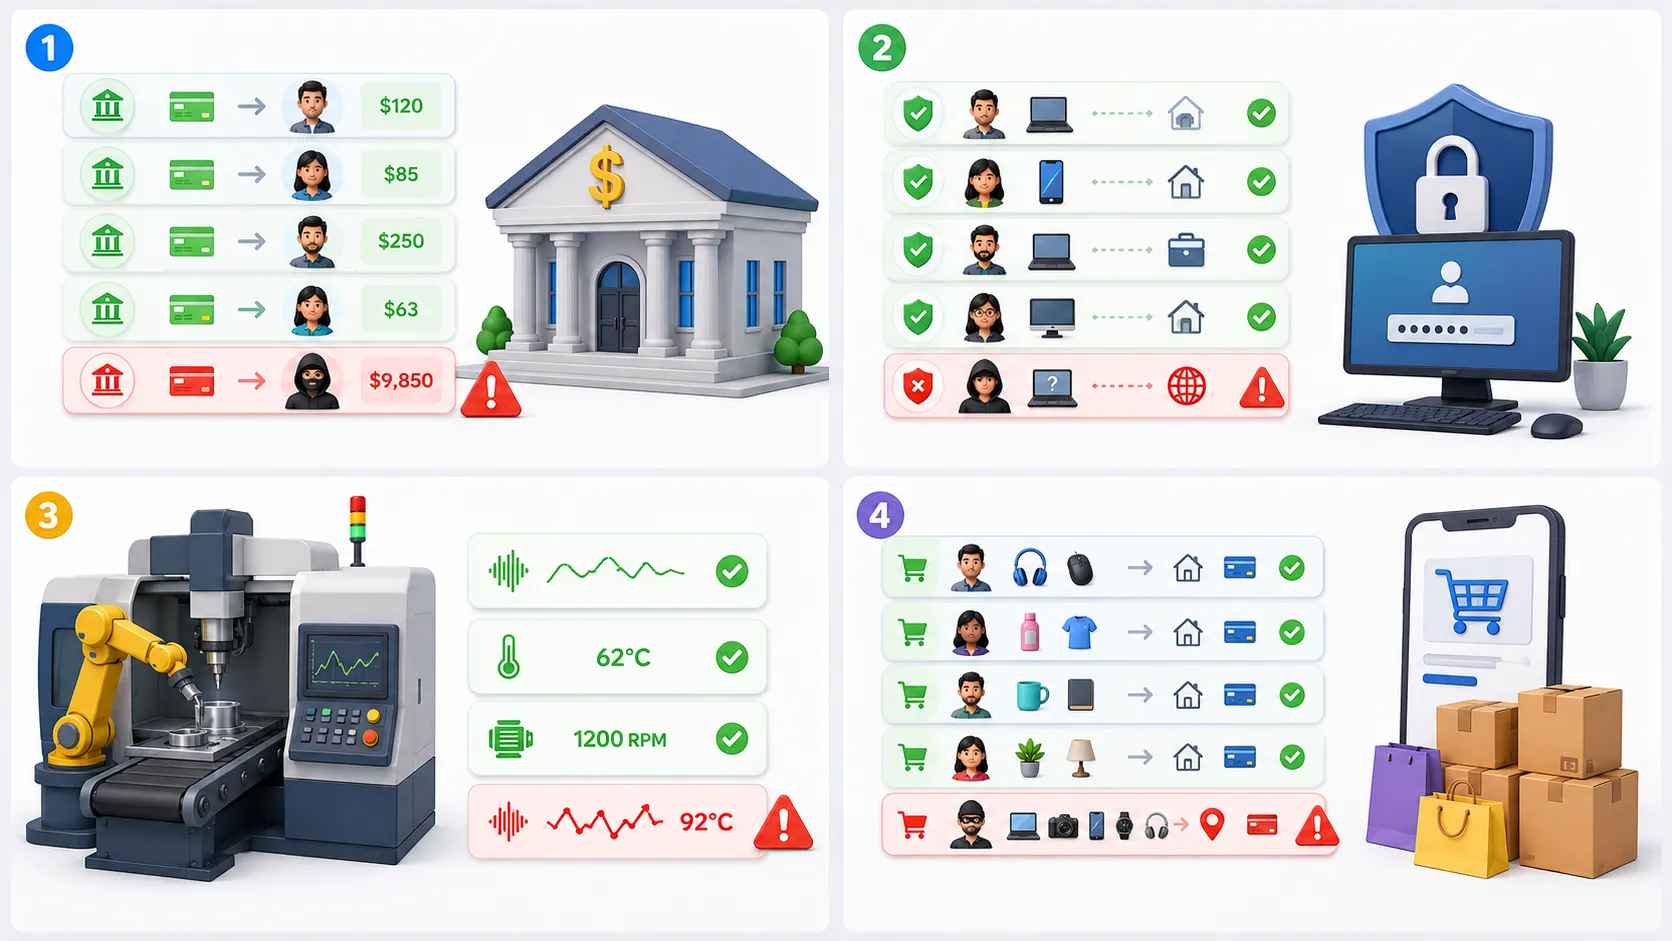
Real-Life Uses of Anomaly Detection
Anomaly detection is used in many industries.
Fraud Detection
Banks and payment companies can use anomaly detection to identify unusual transactions.
The system may check:
Transaction amount
Location
Device
Time
Merchant type
Past spending behaviour
A transaction that looks very different from the customer’s normal activity may be sent for review.
Cybersecurity
Security systems can look for unusual login attempts, network activity or file access.
For example, an employee who normally downloads ten files a day may suddenly download thousands of files late at night.
That behaviour may need investigation.
Manufacturing
Factories use sensors to measure heat, pressure, vibration and machine speed.
If a machine begins producing unusual readings, it may be close to failure.
Finding the problem early can help prevent expensive damage.
E-Commerce
Online stores may use anomaly detection for:
Fake accounts
Unusual coupon use
Suspicious returns
Sudden order spikes
Payment fraud
Bot activity
The Main Challenge With Anomaly Detection
The biggest challenge is deciding what “normal” means.
Normal behaviour can change.
A customer may spend more during a festival. Website traffic may rise during a sale. A factory machine may behave differently after maintenance.
If the system is too sensitive, it may create too many false alerts.
If it is not sensitive enough, it may miss important problems.
A useful anomaly detection system needs:
Good-quality data
Regular updates
Suitable alert levels
Human review
Clear business rules
Continuous monitoring
The goal is not to mark every unusual event as dangerous.
The goal is to find unusual events that are worth checking.
What Is Dimensionality Reduction?
Some datasets contain hundreds or even thousands of features.
This can make the data difficult to understand, display and process.
Dimensionality reduction means reducing the number of features while keeping as much useful information as possible.
Imagine a long book containing 500 pages.
You may create a ten-page summary that keeps the main ideas while removing repeated or less useful details.
Dimensionality reduction works in a similar way.
It tries to create a smaller and simpler version of the data.
For example, a customer dataset may contain:
Age
Income
Purchase frequency
Average order value
Website activity
Product preferences
Device information
Location
Discount use
Return behaviour
Some of these features may carry similar information.
Dimensionality reduction can combine related patterns into fewer new features.
Why Is Dimensionality Reduction Useful?
It can help with:
Faster model training
Easier data visualisation
Less storage
Removing noise
Reducing repeated information
Finding important hidden patterns
One popular method is Principal Component Analysis, also called PCA.
PCA creates new combined features that capture important variation in the data.
You do not need to understand the full mathematics to understand the basic idea.
Imagine describing a person using 50 different measurements.
Some of those measurements may be closely related.
PCA may reduce them into a few broader patterns, such as body size, shape and movement.
Limits of Dimensionality Reduction
Reducing features can make data easier to use, but some information may be lost.
The new features may also be difficult to explain.
For example, a new combined feature may contain parts of spending, order frequency and browsing behaviour.
It may be useful mathematically, but it may not have a simple business name.
This creates a trade-off.
A simpler dataset may be easier to process, but harder to explain.
The right balance depends on the project.
What Is Association Rule Learning?
Association rule learning finds items or actions that often happen together.
You may have seen suggestions such as:
Customers who bought this also bought that
Frequently bought together
People who purchased a phone also viewed phone covers
These suggestions can be supported by association patterns.
Imagine a grocery store studying thousands of shopping baskets.
The store may discover that customers who buy pasta often also buy pasta sauce.
This does not mean pasta causes people to buy sauce.
It only shows that the two items often appear together.
Common terms used in association rule learning include:
Support: How often the item combination appears
Confidence: How often one item appears when another item is present
Lift: Whether the combination appears more often than expected by chance
These terms help teams decide whether a pattern is useful.
Association Rules in E-Commerce
An online store can use association rules to understand product combinations.
For example:
Laptop buyers often purchase a mouse
Camera buyers often purchase a memory card
Formal-shirt buyers may also purchase a belt
Baby-product buyers may purchase wipes and feeding items
These patterns can support:
Product bundles
Cross-selling
Recommendation sections
Store layout
Inventory planning
Email campaigns
However, the business should avoid forcing irrelevant recommendations.
A customer who buys a laptop once does not need to see laptop recommendations for the next six months.
Useful recommendations should consider both product relationships and customer context.
Advantages of Unsupervised Learning
Unsupervised learning is valuable because it can work without manually labelled answers.
It Finds Hidden Patterns
The algorithm may find groups or relationships that humans did not expect.
It Works With Large Amounts of Unlabelled Data
Most business data does not already contain perfect labels.
Unsupervised learning can still help explore it.
It Supports Customer Understanding
Clustering can show how different customers behave.
This can help businesses create more relevant services and communication.
It Can Find Unusual Behaviour
Anomaly detection can identify suspicious activity, machine problems or rare events.
It Helps Simplify Complex Data
Dimensionality reduction can make very large datasets easier to process and display.
Limitations of Unsupervised Learning
Unsupervised learning also has important limits.
Results May Be Difficult to Check
There may be no correct answer showing whether a cluster is perfect.
Groups May Be Hard to Explain
An algorithm may create mathematically clear clusters that have little business value.
Results Depend on Feature Selection
Different features can produce very different groups.
Data Scaling Can Change the Result
Large numerical values may receive too much importance if features are not scaled.
Algorithms Can Find Meaningless Patterns
A pattern may exist by chance and still look interesting.
Human Interpretation Is Still Needed
The algorithm can find structure, but it cannot fully understand the real-world meaning of that structure.
Supervised Learning vs Unsupervised Learning
The easiest difference is the presence of labels.
Supervised learning uses examples with correct answers.
Unsupervised learning uses data without predefined answers.
For example:
Predicting whether an email is spam is supervised learning.
Grouping emails by writing style or sender behaviour can be unsupervised learning.
Predicting whether a customer will leave is supervised learning.
Discovering natural customer groups is unsupervised learning.
Neither method is always better.
The right choice depends on the problem and the available data.
When Should You Use Unsupervised Learning?
Unsupervised learning can be useful when:
You do not have labelled data
You want to explore a large dataset
You want to find natural customer groups
You need to detect unusual behaviour
You want to reduce the number of features
You want to discover items that often appear together
It may not be the best choice when:
You need one exact prediction
Correct labels are already available
The result must be easy to explain
The business cannot review or interpret the output
Small changes in the groups may create serious risks
Frequently Asked Questions About Unsupervised Learning
What is unsupervised learning in simple words?
Unsupervised learning is a machine learning method that finds patterns in data without being given correct answers or labels.
What is the main goal of unsupervised learning?
Its main goal is to discover useful structure, such as groups, unusual data points or hidden relationships.
What are the main types of unsupervised learning?
The main types include clustering, anomaly detection, dimensionality reduction and association rule learning.
What is a real-life example of unsupervised learning?
Customer segmentation is a common example. An online store can group customers based on spending, shopping frequency and discount use without manually naming the groups first.
Is K-means supervised or unsupervised?
K-means is an unsupervised learning algorithm. It groups similar data points into a chosen number of clusters.
What is anomaly detection?
Anomaly detection finds data points or behaviour that are very different from the normal pattern.
What is the difference between clustering and classification?
Clustering finds groups without predefined labels. Classification learns from labelled examples and predicts a known category.
Can unsupervised learning make predictions?
It mainly finds patterns rather than predicting known labels. However, its results can support later predictions, recommendations or business decisions.
Does unsupervised learning need human review?
Yes. Human review is important because the algorithm may find patterns without understanding their real meaning.
Key Takeaways
Unsupervised Learning Summary
Unsupervised learning works with unlabelled data.
Clustering places similar data points into groups.
K-means creates a fixed number of clusters.
Hierarchical clustering shows how smaller groups connect to larger groups.
DBSCAN finds dense groups and unusual points.
Customer segmentation helps e-commerce businesses understand different buyer types.
Anomaly detection finds behaviour that does not match normal patterns.
Dimensionality reduction simplifies datasets with many features.
Association rules find products or actions that often appear together.
Human interpretation is always needed.
Final Thoughts
Unsupervised learning is useful when we have data but do not already know what answers to look for.
It acts like an explorer.
It searches through customer behaviour, transactions, sensor readings or product data and shows us where patterns may exist.
Sometimes it finds clear groups.
Sometimes it finds one unusual point.
Sometimes it reduces a complex dataset into a simpler view.
But the algorithm does not fully understand the meaning of what it finds.
A customer cluster is not automatically a perfect customer type. An unusual transaction is not automatically fraud. A product relationship does not prove that one purchase caused another.
The value comes from combining machine learning with human judgement.
The best unsupervised learning projects do not simply create clusters and stop.
They ask whether the patterns are useful, stable, fair and connected to a real problem.
That is what turns hidden data patterns into useful business knowledge.


