


Imagine you manage a small café. Some customers visit almost every day but spend very little. Some come only on weekends and place large orders. Others visit once or twice a month and usually buy premium items. You have hundreds of customer records, but nobody has labelled them as “regular,” “high-value,” or “occasional.”
How would you find these groups without checking every customer manually?
This is exactly the kind of problem K-Means Clustering can solve.
It studies the available data, notices which records are similar, and places them into useful groups. You do not provide ready-made labels. The algorithm discovers patterns on its own. That is why K-Means is often one of the first clustering methods beginners learn in machine learning.

What Is K-Means Clustering?
K-Means clustering is an unsupervised machine learning algorithm used to divide similar data points into a fixed number of groups called clusters.
The word “ Unsupervised” matters. In supervised learning, data already has an answer or label. For example, an email may be marked as spam or not spam. In Unsupervised learning, those labels are missing. The algorithm has to study the data and find structure by itself.
K-Means forms groups by comparing the distance between records. Each group has a central point called a centroid. The algorithm keeps updating these centroids until the groups become stable.
Its basic goal is simple: data points inside the same cluster should stay close to their own centroid. In technical language, K-Means tries to reduce the distance between each point and the centre of its cluster. This objective is commonly measured using inertia, also known as within-cluster sum of squares.
First Understand What Clustering Means
Clustering means arranging data into groups based on similarity.
You already use this idea in daily life. A clothing store separates products into different sections. A music app groups songs by listening behaviour. A travel company may group customers into budget travellers, family travellers, luxury travellers, and frequent business travellers.
A human can create these groups using experience. A clustering algorithm creates them by comparing data.
Suppose a travel website stores two details about each customer:
Number of trips booked in a year
Average amount spent per trip
Customers with similar booking habits may appear close together when these values are shown on a graph. K-Means can detect those natural groups and assign every customer to one of them. This practical use is called customer segmentation using K-Means.
What Do “K” and “Means” Mean?
The name sounds mathematical, but the idea is easy.
K Means the Number of Clusters
You choose how many groups the algorithm should create.
If K is 2, the data is divided into two clusters. If K is 3, it creates three clusters. Choosing the correct K is important. Later, we will use the Elbow Method and Silhouette Score to make this decision more sensible. K-Means requires the number of clusters to be selected before the main clustering process begins.
Means Refers to the Average
Every cluster has a centre called a centroid. This centre is calculated using the average, or mean, of the data points inside that cluster.
Imagine one cluster contains customers who spend ₹2,000, ₹2,500, and ₹3,000 per booking. Their average spending is ₹2,500. That average helps define the centre of the group. When the members of the cluster change, the centroid is calculated again.
This repeated update is the heart of how K-Means clustering works.
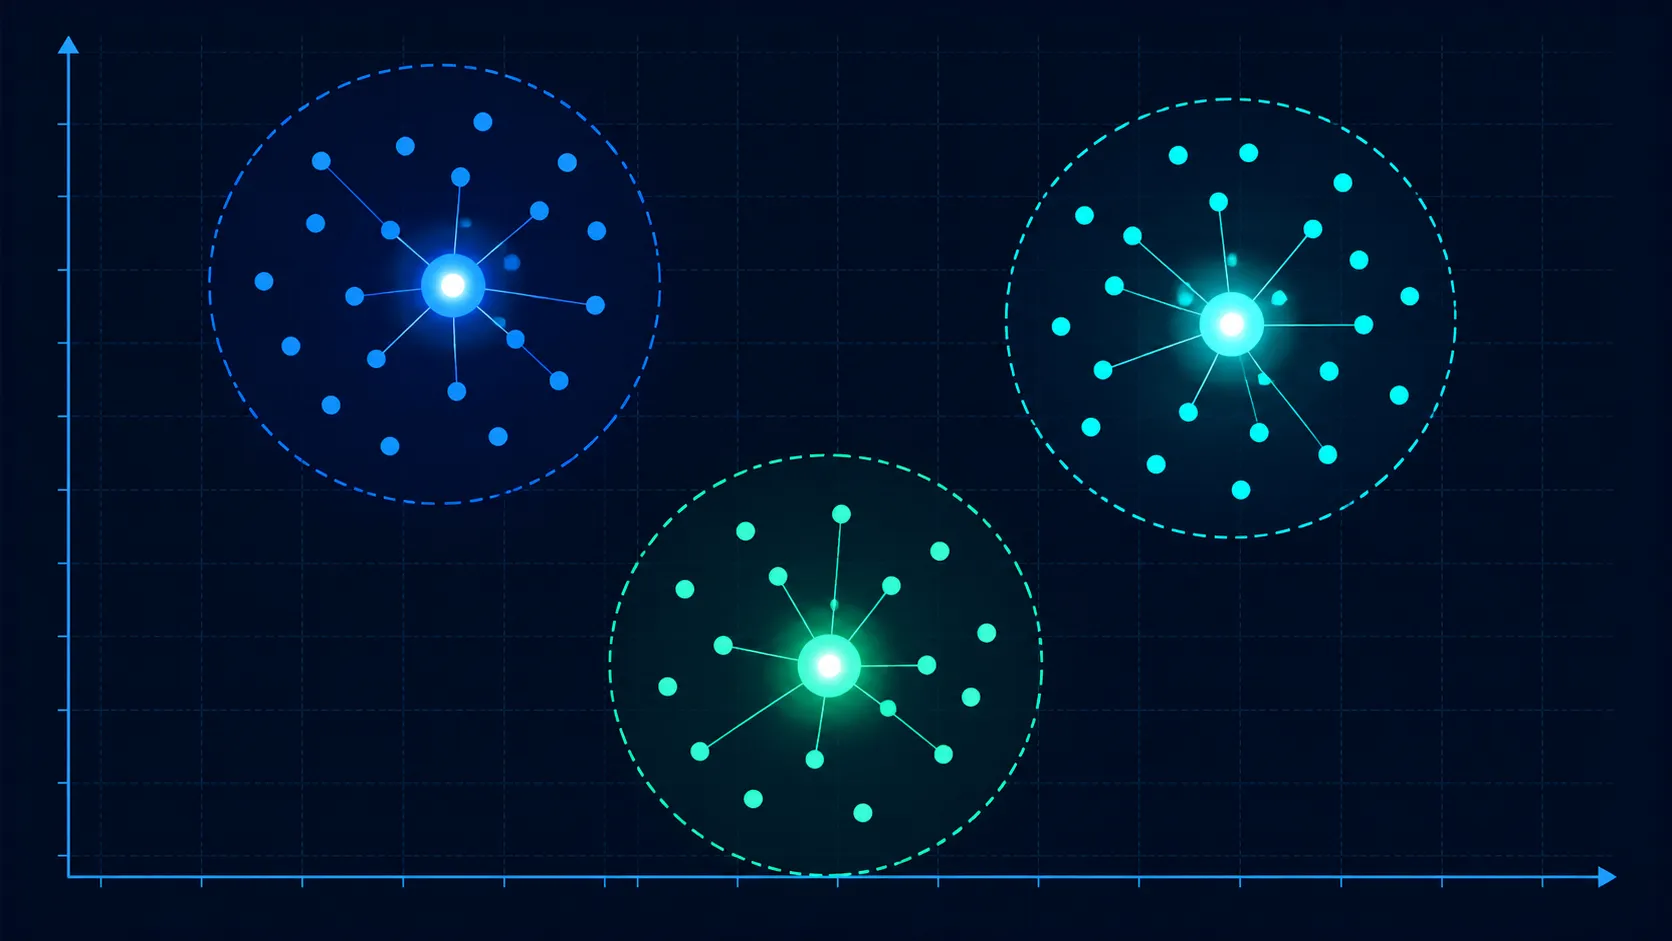
A Real-Life K-Means Example
Let us look at an online clothing store.
The store owner tracks two details for every registered user:
Orders placed per year
Average order value (spending per order)
Without any manual rules, the owner sets K = 3 to group these shoppers automatically.
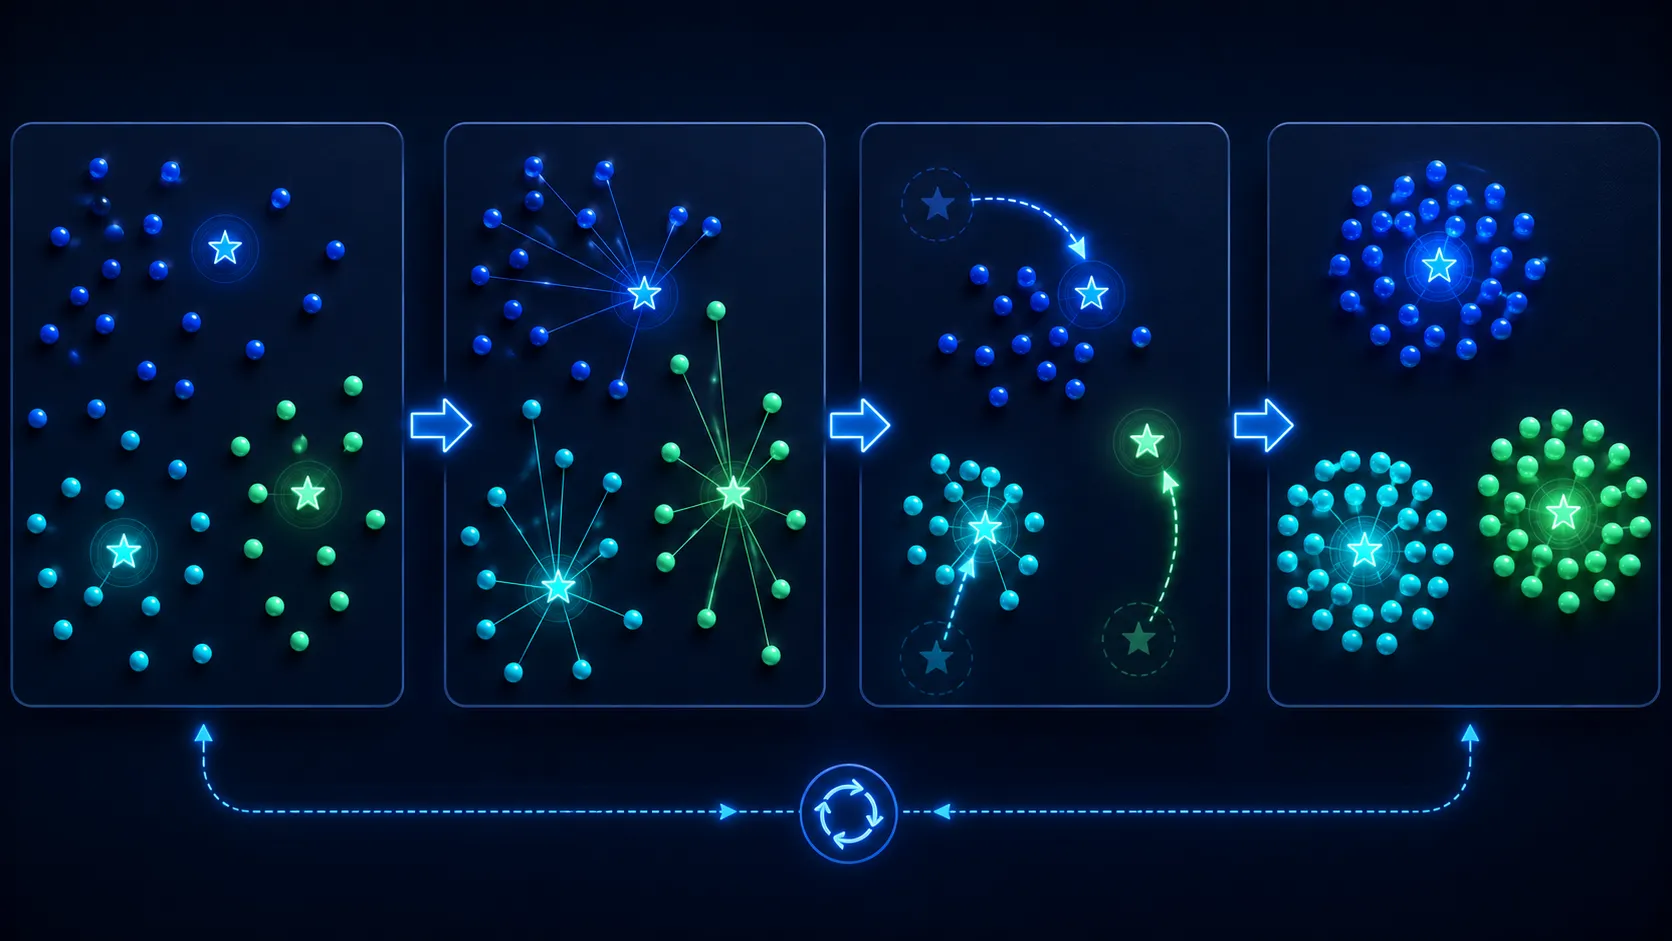
At first, K-Means places three starting centroids on the dataset.
Every customer is assigned to the nearest centroid based on their shopping activity.
The algorithm then recalculates the average position of each group and moves the centroids to their true centers.
Customers are reassigned if a different centroid becomes closer to them.
After a few repeating rounds, the algorithm converges and divides shoppers into three clear segments:
High-Frequency Bargain Hunters: High order count, low spending per order.
Occasional Luxury Buyers: Very few orders, extremely high spending per order.
Standard Regular Shoppers: Moderate orders, average spending per order.
K-Means labels these as Cluster 0, Cluster 1, and Cluster 2. The store owner can now send targeted discounts to occasional buyers and loyalty perks to frequent shoppers.
Four Terms You Must Remember
A data point is one record, such as one customer.
A feature is a measurable detail, such as spending, age, visits, or purchase frequency.
A cluster is a group of similar data points.
A centroid is the calculated centre of a cluster.
Once these terms are clear, the algorithm becomes much easier. K-Means is not performing magic. It is repeatedly measuring closeness, forming groups, and updating their centres.
Why Is K-Means Popular?
K-Means is popular because its core process is easy to understand and it can work efficiently with large numeric datasets. It is used for customer segmentation, image colour compression, document grouping, product grouping, and user behaviour analysis.
However, it is not suitable for every dataset. It works best when groups are reasonably compact and distance is a meaningful way to compare records. It may struggle when clusters have unusual shapes, very different sizes, or strong outliers. Centroid-based clustering methods can be sensitive to initial conditions and outliers, while K-Means generally performs better when groups have roughly similar size and shape.
Before using the algorithm in Python, we need to understand data preparation, distance calculation, centroid selection, and the right way to choose K.
How Does K-Means Clustering Work Step by Step?
Now that we understand the basic idea of K-Means, let us see how it actually works.
K-Means may look technical at first, but its process is simple. It keeps repeating the same few steps until the data points are placed into suitable groups.
Let us continue with the café example.
Suppose a café owner has customer data based on two things:
How many times a customer visits the café in one month
How much money the customer spends during each visit
The owner wants to divide customers into groups based on their behaviour. Some customers may visit often but spend less. Some may visit less but spend more. Others may visit regularly and spend a medium amount.
K-Means can find these groups automatically.
Step 1: Choose the Number of Clusters
The first step is choosing the value of K.
K tells the algorithm how many groups it needs to create.
For example:
If K is 2, the algorithm creates two clusters.
If K is 3, it creates three clusters.
If K is 5, it creates five clusters.
In our café example, suppose the owner wants three types of customers. Therefore, we choose:
K = 3
This means the algorithm will divide all customers into three different clusters.
Choosing the correct value of K is important. If we choose too few clusters, very different customers may be placed in the same group. If we choose too many clusters, similar customers may be divided into unnecessary small groups.
Later, we will learn how the Elbow Method and Silhouette Score can help us choose a suitable value of K.
Step 2: Select the Starting Centroids
After choosing K, the algorithm selects starting points for each cluster.
These starting points are called centroids.
A centroid represents the centre of a cluster.
Since we selected K = 3, the algorithm needs three starting centroids.
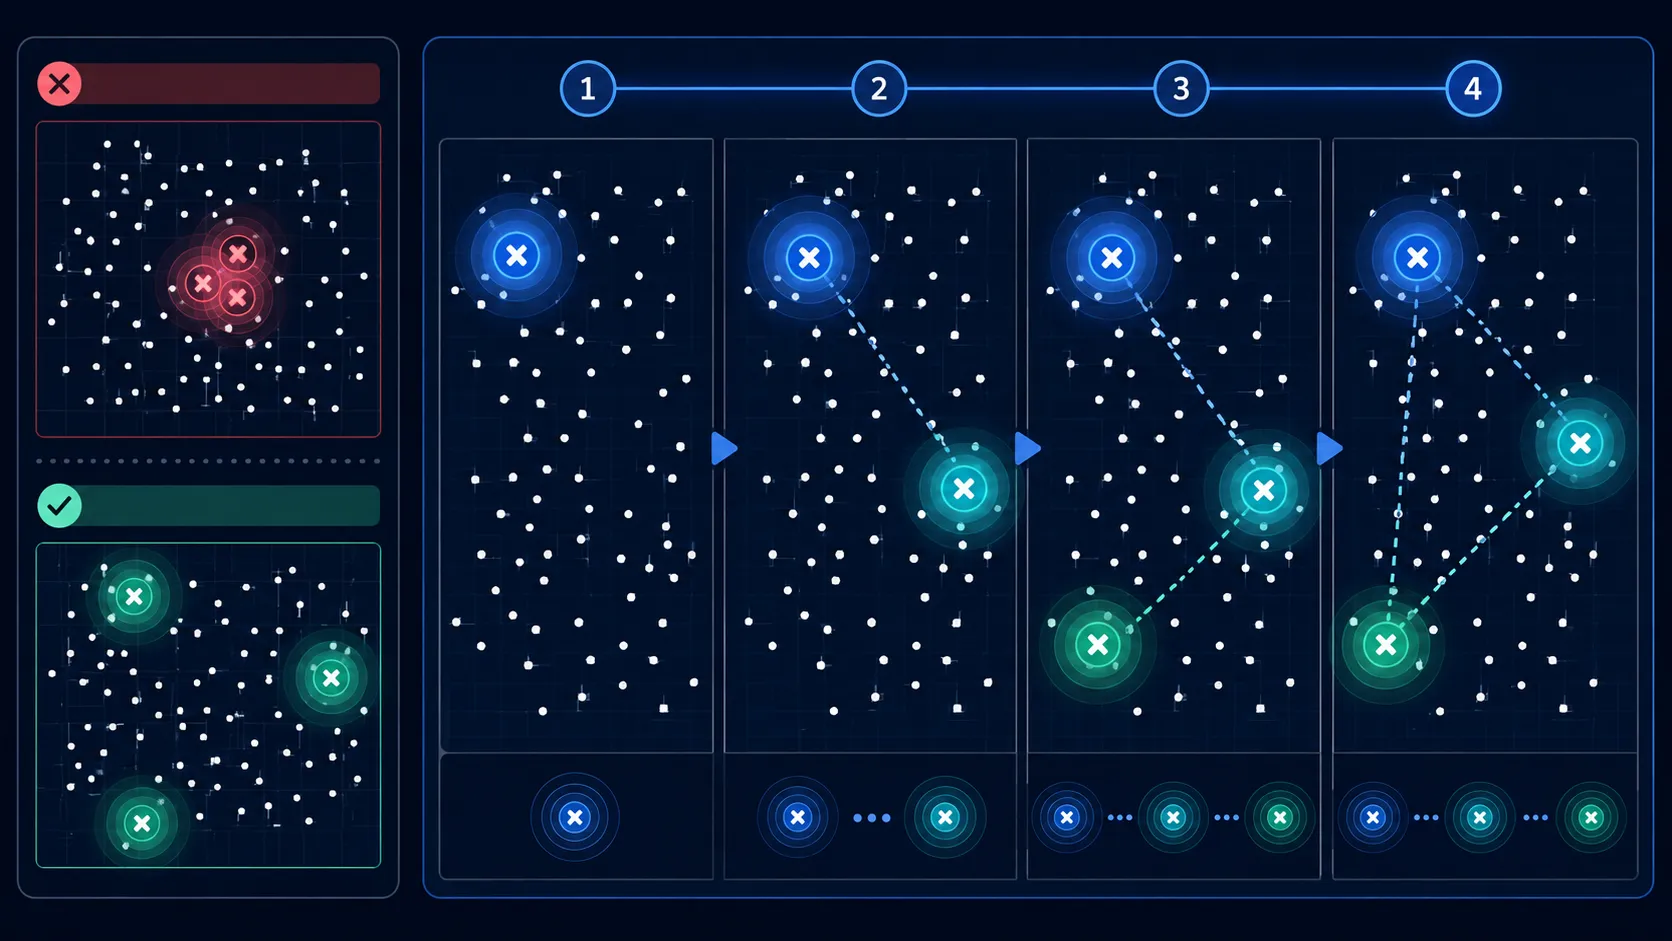
At the beginning, these centroids may be selected randomly from the available data. They are not final cluster centres. They only give the algorithm a place to begin.
Imagine that the first centroid is placed near customers who visit less and spend less.
The second centroid may be placed near customers who visit often and spend a medium amount.
The third centroid may be placed near customers who spend more during each visit.
These starting positions can affect the final result.
Sometimes random starting points may not give the best clusters. To reduce this problem, many machine learning tools use a method called K-Means++.
K-Means++ tries to select better starting centroids by keeping them at a reasonable distance from each other. This often helps the algorithm reach a better result.
Step 3: Measure the Distance
Now the algorithm checks the distance between every customer and every centroid.
Each customer is assigned to the centroid that is closest to them.
Suppose one customer visits the café 12 times a month and spends around ₹250 per visit.
The algorithm compares this customer with all three centroids.
If this customer is closest to the centroid representing regular visitors with medium spending, the customer is placed in that cluster.
The same process happens for every customer in the dataset.
K-Means normally uses Euclidean distance to measure how far one point is from another.
Euclidean distance is simply the straight-line distance between two points on a graph.
You do not need to calculate every distance manually while working with Python. Machine learning libraries can calculate it automatically.
Still, the basic idea is useful to understand:
The closer two data points are, the more similar they are considered.
The farther they are, the more different they are considered.
Step 4: Assign Every Data Point to a Cluster
After measuring the distances, every customer is placed into the nearest cluster.
For example, the temporary groups may look like this:
One group may contain customers who visit rarely and spend less.
Another group may contain customers who visit regularly and spend a medium amount.
The third group may contain customers who visit less but spend a large amount.
At this point, the clusters are still temporary.
They are based on the starting centroids, and those centroids may not be in the correct positions yet.
The algorithm must now calculate better cluster centres.
Step 5: Calculate New Centroids
Once all customers are assigned to clusters, K-Means calculates a new centroid for each group.
It does this by finding the average position of all data points inside that cluster.
Let us say one cluster contains three customers.
The first customer visits 8 times a month.
The second customer visits 10 times a month.
The third customer visits 12 times a month.
The average number of visits is 10.
The algorithm also calculates the average spending of these customers.
The average number of visits and the average spending together create the new centroid.
This new centroid is placed closer to the real centre of the group.
The same calculation is done for every cluster.
As a result, all centroids move from their old positions to new positions.
Step 6: Assign the Data Again
After the centroids move, the algorithm again checks the distance between each customer and each new centroid.
A customer who belonged to one cluster earlier may now be closer to another centroid.
In that case, the customer is moved to the new cluster.
After this movement, the algorithm again calculates the average position of each cluster and updates the centroids.
This process keeps repeating:
Measure the distance.
Assign every point to the nearest centroid.
Calculate new centroids.
Move the centroids.
Check the distance again.
The algorithm continues until the clusters stop changing.
When the centroids no longer move much and most data points remain in the same groups, the algorithm stops.
This stage is called convergence.
Why Feature Scaling Is Important
K-Means makes decisions based on distance. Because of this, the scale of each feature can strongly affect the result.
Suppose our dataset has two features:
Monthly visits may have values between 1 and 20.
Yearly spending may have values between ₹10,000 and ₹5,00,000.
The spending values are much larger than the visit values.
During distance calculation, yearly spending may become more powerful than monthly visits. The algorithm may almost ignore the visit data because its numbers are much smaller.
This can create poor or misleading clusters.
Feature scaling solves this problem.
Scaling brings different features into a similar range.
Two common scaling methods are StandardScaler and MinMaxScaler.
StandardScaler changes the values so that the data has a common average and spread.
MinMaxScaler usually changes values to a range between 0 and 1.
For example, after scaling, both monthly visits and yearly spending can be compared fairly.
This allows K-Means to consider both features properly.
A simple rule to remember is:
Before using K-Means, always check whether your numeric features have very different value ranges.
Preparing the Data Before Using K-Means
Good clustering does not depend only on the algorithm. It also depends on the quality of the data.
Before applying K-Means, you should clean and prepare the dataset.
First, check for missing values.
If some customer records do not have spending or visit information, you may need to remove those rows or fill the missing values carefully.
Next, remove duplicate records.
The same customer appearing many times can affect the cluster result.
You should also check for outliers.
An outlier is a value that is very different from the rest of the data.
For example, if most café customers spend between ₹100 and ₹1,000, but one customer shows spending of ₹1,00,000, that value may pull the centroid away from the real group.
K-Means is sensitive to such unusual values.
You should also select only useful features.
Adding unnecessary columns can confuse the algorithm. For customer segmentation, useful features may include visit count, average spending, purchase frequency, or total orders.
Personal details such as customer name, phone number, or email address should not be used for distance-based clustering.
After cleaning the data, selecting useful features, and applying scaling, the dataset becomes ready for K-Means.
How to Choose the Best Value of K
K-Means cannot decide the number of clusters on its own. We must give it the value of K before training the model.
This creates an important question:
How do we know whether K should be 2, 3, 4, or something else?
There is no single value that works for every dataset. The right number depends on the data and the problem we are trying to solve. However, two methods can help us make a better decision:
Elbow Method
Silhouette Score
Using the Elbow Method
The Elbow Method checks how closely the data points fit inside their clusters for different values of K.
For example, we can train K-Means several times using:
K = 1, 2, 3, 4, 5, 6, and so on.
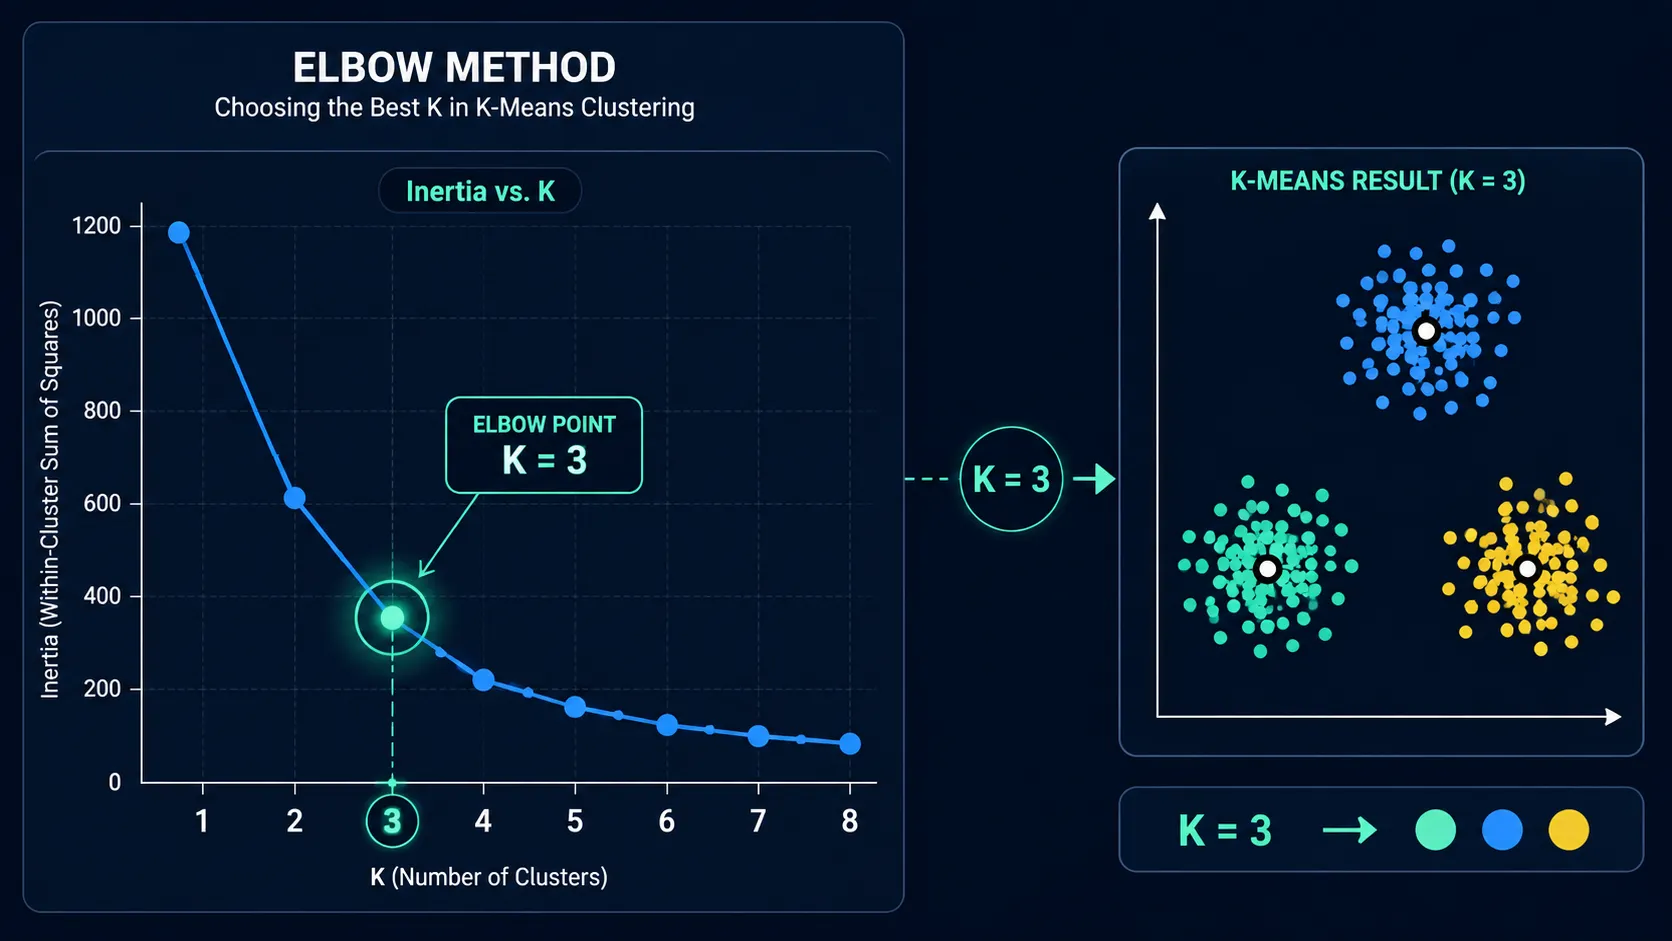
For every value of K, we calculate a value called inertia.
Inertia measures the total distance between each data point and the centroid of its cluster. Lower inertia usually means that data points are closer to their cluster centres.
As K increases, inertia will keep decreasing. This happens because more clusters make it easier to place data points closer to a centroid.
However, adding more clusters does not always make the result more useful.
We look for a point where the drop in inertia starts becoming much smaller. On a graph, this point often looks like the bend of an elbow. That is why it is called the Elbow Method.
Suppose inertia drops quickly from K = 1 to K = 3, but after K = 3 the improvement becomes very small. In that case, K = 3 may be a good choice.
The elbow is not always clear. Sometimes the graph changes slowly and there is no obvious bend. In that situation, we should also check the Silhouette Score and the real purpose of the clusters.
Using the Silhouette Score
The Silhouette Score checks two things:
How close a data point is to other points in its own cluster
How far it is from points in the nearest different cluster
A higher score usually means the clusters are more clearly separated.
The score normally stays between -1 and 1.
A value close to 1 means the data points fit well inside their own clusters.
A value near 0 means some clusters may be overlapping.
A negative value may mean that several data points were placed in the wrong clusters.
You can calculate the Silhouette Score for different values of K and compare the results. However, you should not select K only because it gives the highest score. The final clusters must also make sense for the real problem. Scikit-learn provides silhouette_score for this purpose, while Google’s clustering guidance also recommends checking cluster quality instead of trusting only a visual graph.
K-Means Clustering in Python
Let us apply K-Means to our café customer example.
We will use two customer features:
Monthly visits
Average spending per visit
The following code uses pandas and scikit-learn:
import pandas as pd
from sklearn.cluster import KMeans
from sklearn.preprocessing import StandardScaler
# Sample café customer data
customer_data = {
"monthly_visits": [2, 3, 4, 8, 9, 11, 3, 4, 5, 10],
"average_spending": [150, 180, 220, 350, 380, 420, 900, 1100, 1000, 400]
}
customers = pd.DataFrame(customer_data)
# Select the features used for clustering
features = customers[["monthly_visits", "average_spending"]]
# Bring both features to a similar scale
scaler = StandardScaler()
scaled_features = scaler.fit_transform(features)
# Create and train the K-Means model
kmeans = KMeans(
n_clusters=3,
init="k-means++",
n_init="auto",
random_state=42
)
customers["cluster"] = kmeans.fit_predict(scaled_features)
print(customers)
Let us understand the important parts of this code.
StandardScaler() brings monthly visits and average spending to a similar scale.
n_clusters=3 tells K-Means to create three customer groups.
init="k-means++" helps the model choose better starting centroids.
random_state=42 keeps the result stable when the code is run again.
fit_predict() trains the model and gives a cluster label to every customer.
The current stable scikit-learn documentation supports these K-Means settings, including K-Means++ initialization and automatic handling of repeated starting runs through n_init="auto".
Understanding the Cluster Results
After running the code, every customer receives a cluster number.
You may see labels such as:
Cluster 0
Cluster 1
Cluster 2
These numbers do not explain what each group means. They are only IDs created by the algorithm.
You must study the customers inside each cluster.
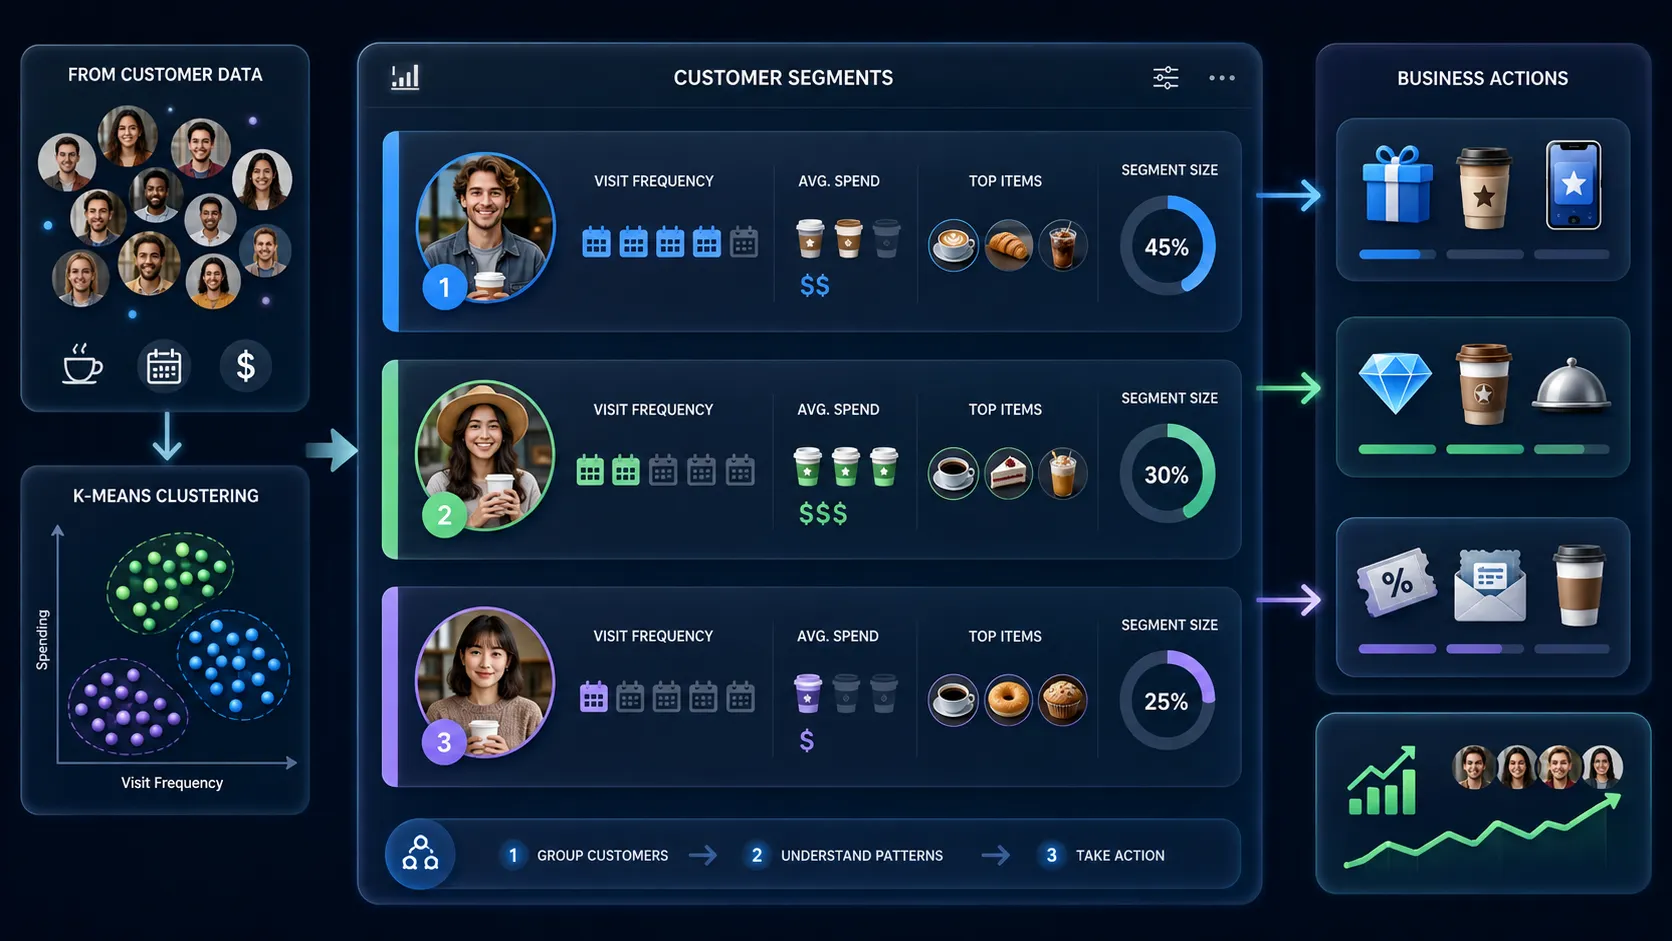
For example, after checking the average visits and spending, you may discover:
Cluster 0 contains regular customers with medium spending.
Cluster 1 contains occasional customers with high spending.
Cluster 2 contains customers with low visits and low spending.
You can then give these clusters useful business names such as:
Regular Visitors
Premium Customers
Occasional Customers
This step turns the machine learning result into something the café owner can actually use.
The owner may give reward points to regular visitors, premium offers to high-spending customers, and return coupons to occasional customers.
This is why clustering is more than creating groups. The real value comes from understanding those groups and taking a useful action.
Common K-Means Mistakes to Avoid
One common mistake is choosing K without testing different values.
Another mistake is using features with very different scales. Since K-Means depends on distance, large values may control the result.
Do not use columns such as customer name, phone number, order ID, or email address. These details do not represent customer behaviour.
You should also check for outliers. One extremely large value can pull a centroid away from the main group.
Avoid assuming that every cluster is automatically useful. Always examine the size, average values, and behaviour of each group.
Finally, do not treat cluster numbers as ranks. Cluster 2 is not better than Cluster 1. The numbers have no special order.
Limitations of K-Means Clustering
K-Means works well when clusters are fairly clear, compact, and separated.
However, it may struggle when groups have unusual shapes. It normally creates clusters around central points, so curved or long-shaped groups may not be separated correctly.
It can also struggle when one cluster is much larger than another or when the dataset contains many outliers.
The starting centroid positions can affect the result, although K-Means++ helps reduce this problem.
K-Means also works mainly with numeric data. Text labels and categories must be prepared carefully before they can be used.
Google’s machine learning guidance notes that K-Means is efficient, but it can be sensitive to outliers, starting points, high-dimensional data, and clusters with very different shapes or sizes.
Final Thoughts
K-Means Clustering becomes much easier once you understand its repeating process.
Choose K, select starting centroids, measure distance, assign points, update the centroids, and repeat until the groups become stable.
The algorithm can help businesses understand customers, group products, study user behaviour, organize documents, and find hidden patterns in data. Once you master grouping unlabeled data, you can also explore tree-based supervised algorithms like XGBoost vs LightGBM to make precise predictions.
Still, a K-Means model is only useful when the data is clean, the features are meaningful, and the final clusters make sense in real life.
Start with a small dataset, draw the points on a graph, and watch how the centroids move. Once you see that movement, K-Means stops feeling like a difficult machine learning algorithm and starts feeling like a simple method for finding meaningful groups.


